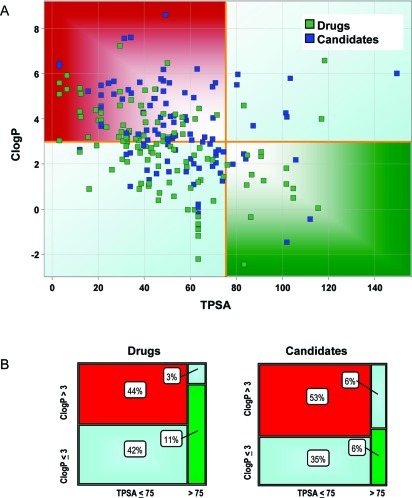
Figure 1.
(A) Distribution of drugs and candidates in the ClogP and TPSA space. Orange lines represent the cutoff values for ClogP (3) and TPSA (75 Å2) relative risk factors. Compounds are colored by compound type: drugs are shown in light green and candidates in dark blue. Compounds in the lower right quadrant (ClogP < 3 and TPSA > 75 Å2) are considered to have lower risk for adverse safety findings. (B) Mosaic plots of drugs and candidates. Green boxes represent the percentage of compounds within the low-risk safety space (ClogP < 3 and TPSA > 75 Å2), and the red boxes represent the compounds in higher risk space (ClogP > 3 and TPSA < 75 Å2). The number in each box reflects the percentage of compounds in that category.

