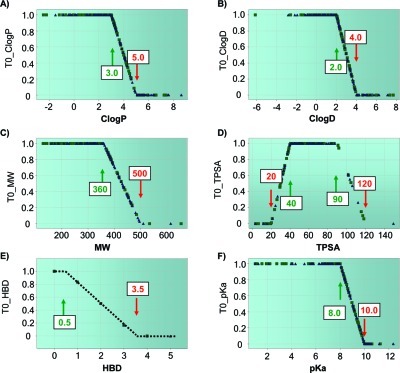
Figure 4.
Each plot represents one of the six physicochemical property desirability functions used to generate the CNS MPO. Each point on a plot represents a drug or candidate: (A) ClogP; (B) ClogD; (C) MW; (D) TPSA; (E) HBD; (F) pKa. The most desirable (T0 = 1.0) and least desirable (T0 = 0.0) inflection points are marked with green and red arrows, respectively. A linear function was used to determine the desirability scores between the inflection points.

