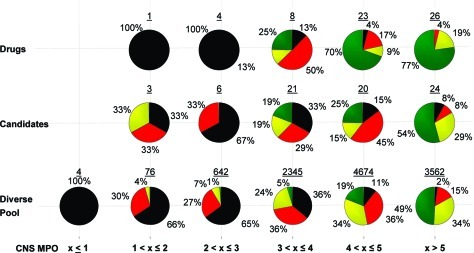
Figure 9.
Pie chart of binned values for alignment of desired ADME attributes: high Papp, low P-gp, and low CLint,u. Color-coding for desired ADME attributes: 3/3 (green), 2/3 (yellow), 1/3 (red), and no attributes (black). Binned CNS MPO scores are plotted along the x-axis, and drug, candidate, and diverse pool sets are plotted along the y-axis. The number of compounds in each pie is given above the pie graph.

