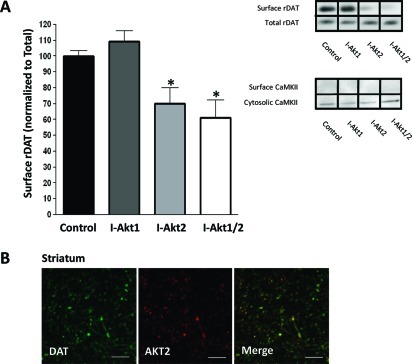
Figure 3.
Inhibition of Akt2 reduces rDAT cell surface expression in rat striatal tissue: (A) Representative immunoblots obtained from striatal slices of biotinylated and total rat DAT (rDAT) after treatment for 1 h with isoform-specific inhibitors of Akt1 (I-Akt1; 12 μM) or Akt2 (I-Akt2; 12 μM), or dual inhibitor of Akt1 and Akt2 (I-Akt1/2; 5 μM). Immunoblots of CaMKII were used to determine the plasma membrane identity of the biotinylated fraction and control for loading. For quantification, the density of each biotinylated rDAT band was normalized to that of its corresponding total rDAT band and expressed as a percentage of control (∗ = p < 0.05; one-way ANOVA followed by Bonferroni posthoc test; n = 11). All data are represented as mean ± SEM. (B) Confocal imaging of rat striatal slices, where green indicates DAT-positive regions and red indicates Akt2-positive regions (scale bar, 12 μm). The merged image depicts yellow regions indicating high levels of expression of both Akt2 and DAT in dopaminergic projections (n = 3). Similar results were obtained for Akt1.

