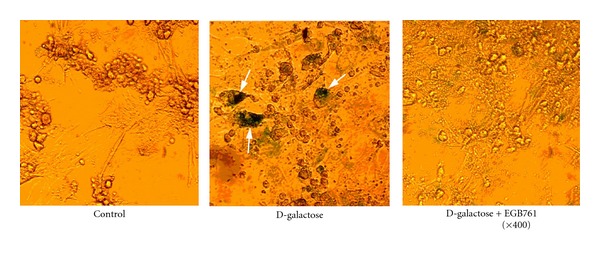
Figure 1.

Response of neonatal rat cardiomyocytes to 5 g·L−1 D-galactose and 5 g·L−1 D-galactose combined with 20 μg·mL−1 EGB761 for 48 h. Phase-contrast images showing morphologic changes and stained cells. (SA-β-gal positive cells; Blue, magnification ×400).
