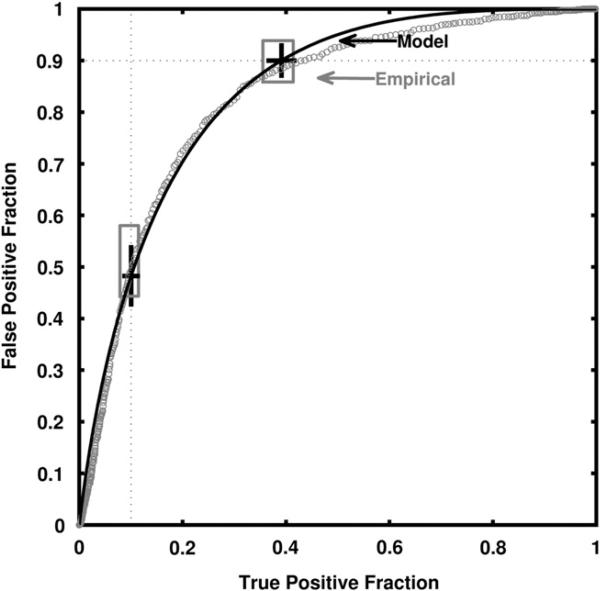
Figure 8.
The classifier's model-based-fit and empirical receiver operating characteristic curves together with model-based and empirical 95% confidence intervals for true-positive fraction (TPF) and false-positive fraction (FPF) at thresholds corresponding to a model-based TPF = 0.90 or a model-based FPF = 0.10. One should note that sampling errors are larger near “the center” of the ROC curve due to the sampling properties of proportions, because FPF and TPF are proportions; hence, larger residuals from receiver operating characteristic curve-fitting algorithms must be expected there.

