
Figure 7.
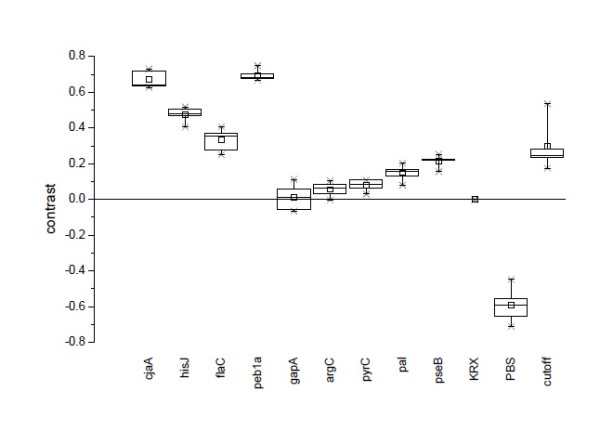
Contrast values from all replicates. The contrast values (n = 5) are presented as a box-whisker-plot where the square represents the arithmetic mean and the horizontal line the median. The whiskers enclose 90% of all values (95% - 5%) and 98% of the values fall between the crosses. CjaA, hisJ, flaC and peb1a show positive signals above the cutoff throughout the slides with only one exception for flaC due to an outlier in the cutoff. On the other hand, gapA, argC and pyrC show negative results, i.e. contrast values significantly below the respective cutoff values for all the slides. The remaining proteins pal and pseB are in the range of the cutoff values.