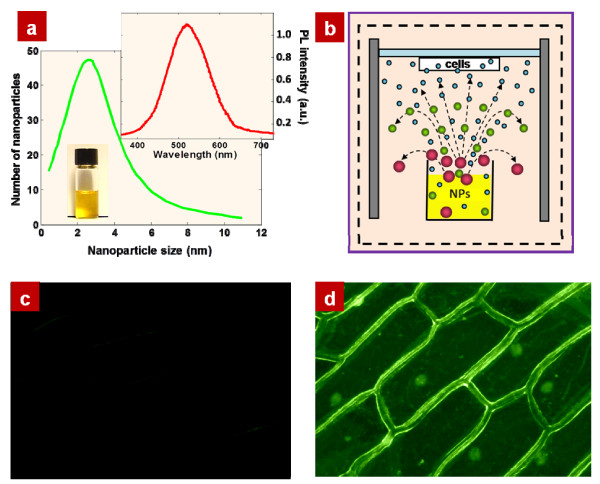
Figure 1.
Size distribution of the NPs (a). Inset shows a typical photoluminescence spectrum of NPs obtained from 3 C-SiC. (b) Schematic view of the experimental set-up. Onion cells are mounted on a mobile holder situated above a colloidal suspension containing the fluorescent NPs. Fluorescence images of the onion epidermal cells exposed to the suspensions without (c) and with (d) NPs.

