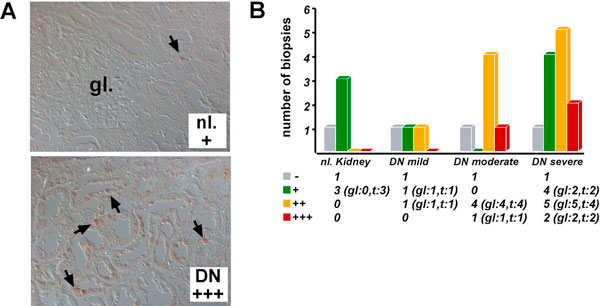
Figure 2.
HIF-1α expression in diabetic nephropathy. HIF-1α immunostaining in formalin-fixed, paraffin-embedded renal biopsy tissues from patients with diabetic nephropathy (DN). (A) Shown are non-affected control kidney tissue (nl. +, less than 25% of tubular epithelial cells are stained) and kidney tissue from a patient with severe DN (DN +++, positive staining is detected in >50% of tubular epithelial cells). Arrows highlight cells with nuclear HIF-1α staining. (B) Summary of HIF-1α expression analysis in DN. DN cases are grouped according to tubulointerstitial injury score as previously described [53]. The number of biopsies with glomerular (gl) or tubular staining (t) is shown in brackets. -, absence of staining; +: 1-25% of cells per visual field with staining; ++: >25-50% and +++: >50% of cells with positive staining.

