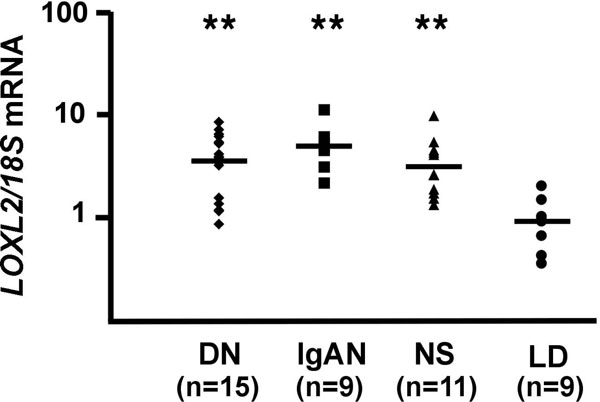
Figure 3.
Increased expression of LOXL2 in CKD. Real time PCR analysis of LOXL2 expression in micro-dissected tubulointerstitium from patients with DN, IgA nephropathy (IgAN) and hypertensive nephrosclerosis (NS). Shown are relative expression values normalized to 18S. Pre-transplant biopsies from living related donor kidneys (LD) were used as control. ** P < 0.001 by Mann-Whitney test.

