
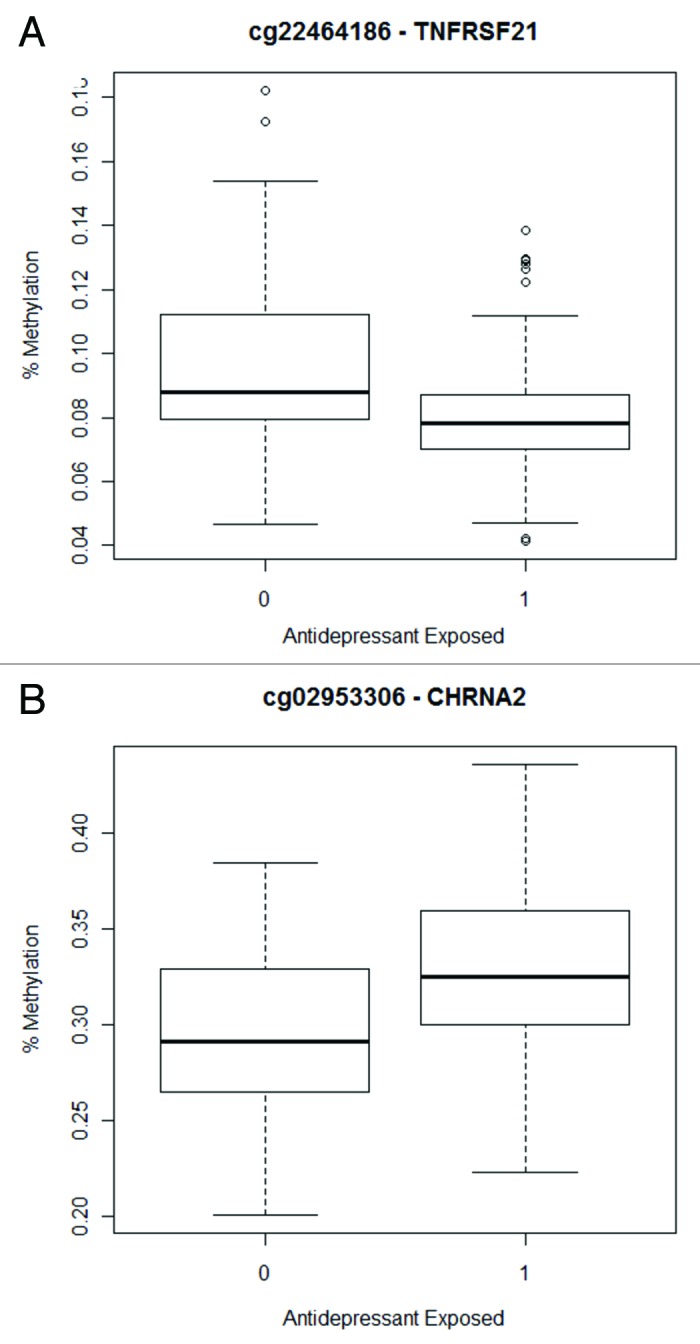
Figure 1. Box plots indicate methylation values for neonates that were not exposed to antidepressants (0) compared with those that were exposed (1) for the CpG sites associated with antidepressant exposure (Class 1 and 2 combined): (A) cg22464186 (TNFRSF21) and (B) cg02953306 (CHRNA2).