
Figure 4.
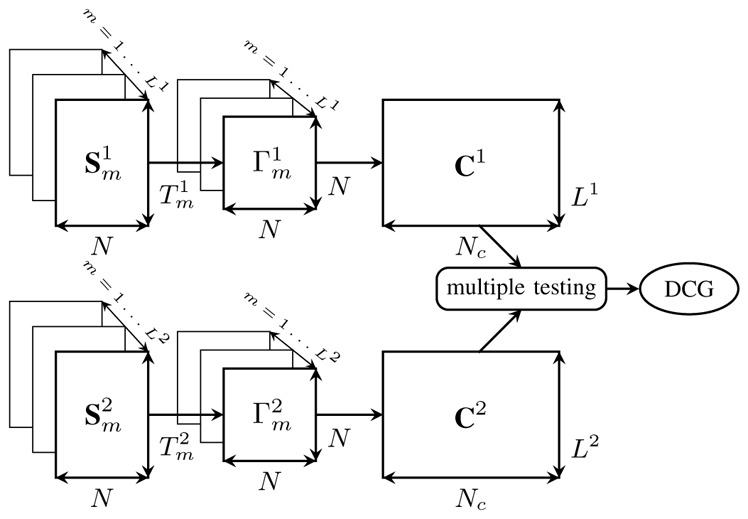
DCG Construction at a given frequency band. Each wavelet coefficient matrix of IED or non-IED segment m (m = 1, …, Ll),
provides one symmetric N × N coupling measure matrix,
. Each
builds the mth row of the matrix Cl ∈
 , which contains all of the information concerning couplings between all of the possible connections at each frequency level. The DCG connections are identified by comparing C1 and C2, using multiple testing.