
Figure 5.
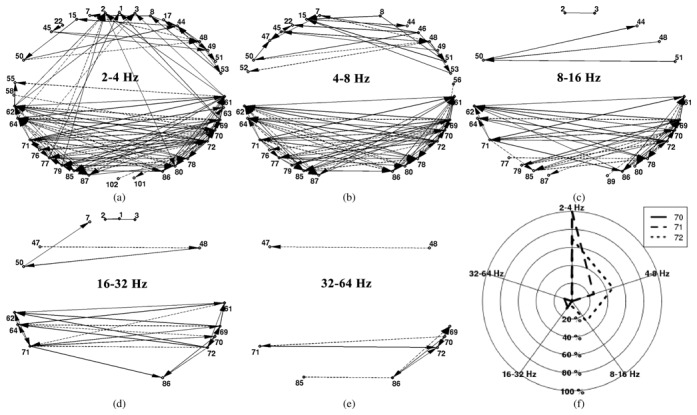
Results of the proposed method for P2. (a)–(e) dDCG (steps 1 and 2) of different frequency bands from 2–64 Hz. These dDCGs are quantified by LI measure (11) in step 3. A multi-object optimization method in step 4 optimizes these LI measure values to estimate the (ℓIED regions. (f) Web plot of estimated (ℓED nodes for P2: nodes 70, 71 and 72 located in left anterior hippocampus. The three related pentagons of LI:[70], LI:[71], and LI:[72] are depicted in solid, dashed, and dotted lines, respectively.