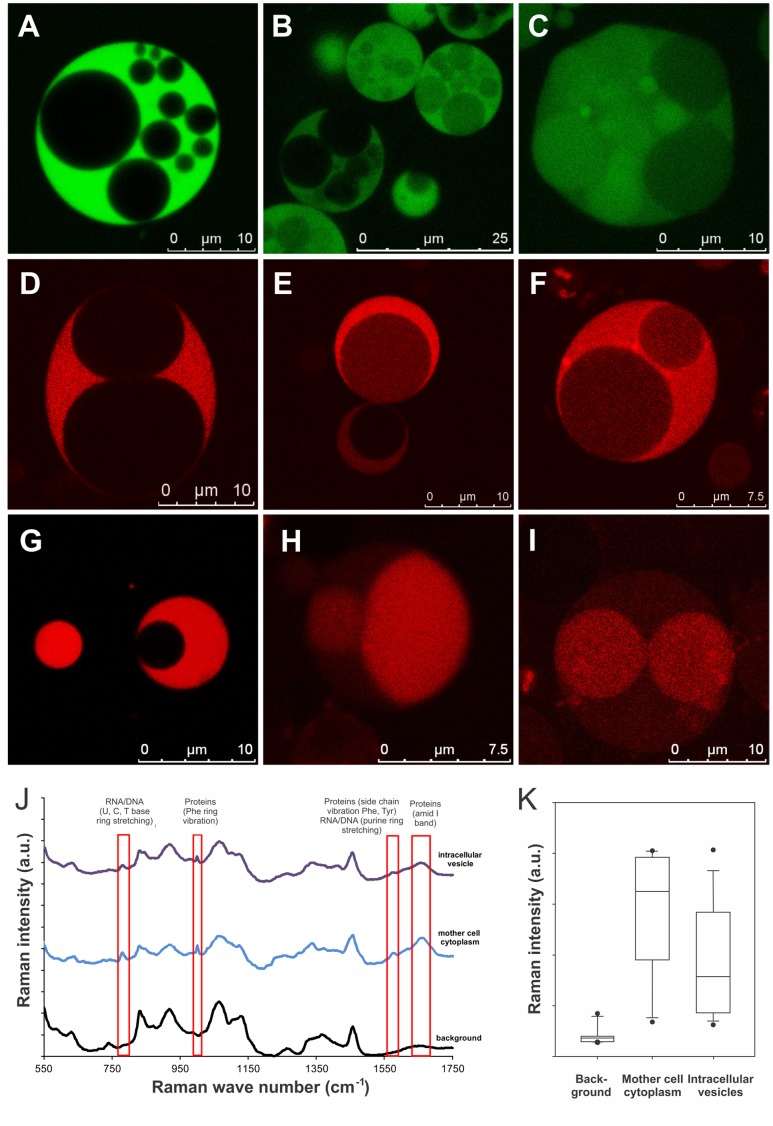
Figure 3. L-form cells feature intracellular viable progeny vesicles.
The viability of progeny vesicles was assessed by GFP synthesis and fluorescence (A–C), spatial distribution of Rho123 (D–F), and reductive metabolism of a tetrazolium dye (G–I). Intracellular vesicles either showed no signals, faint signals, or strong signals, in some cases stronger than the mother cell. Panel J shows baseline corrected and normalized Raman spectra of the average background control (lower curve, n = 10), mother cell cytoplasm with a strong GFP signal (middle curve, n = 13) and non-fluorescent large intracellular vesicles (upper curve, n = 18). The different spectral curves have been offset but the scale was retained. Relevant peaks are indicated by red boxes, and correspond to vibration signals from RNA/DNA (785 cm−1, 1583 cm−1), and proteins (1003 cm−1, 1583 cm−1 and 1666 cm−1). These molecules are present both in the mother cell cytoplasm and, albeit less pronounced, inside the intracellular progeny vesicles. Panel K shows a box plot of Raman intensities measured for the background (buffer), mother cell cytoplasm, and intracellular vesicles at 1666 cm−1, which reflects protein content. The median intensity is lower in intracellular vesicles compared to the mother cell cytoplasm, indicating a slightly lower protein content in the progeny vesicles.

