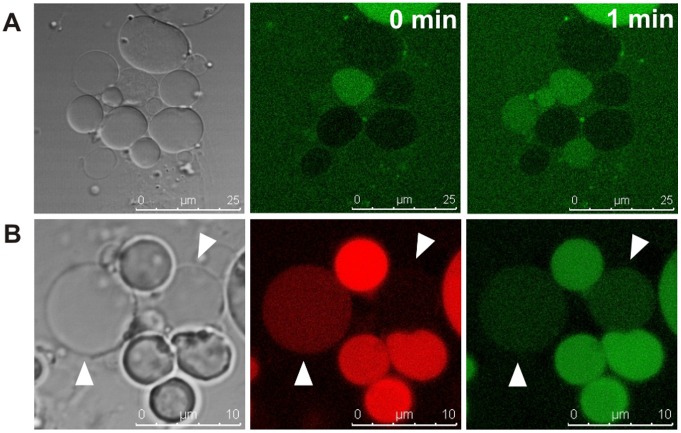
Figure 5. Activation of progeny cells upon release.
Panel A: A large mother cell, which collapsed immediately before the first image was recorded, is shown. At this time point (0 min), only one of the released vesicles displays faint GFP fluorescence, whereas after 1 minute three more vesicles display a clear GFP signal. Panel B: Freshly released daughter vesicles (arrow heads) typically show low phase contrast (left), and weak CTC metabolism (middle) and GFP fluorescence (right), which increases shortly thereafter.

