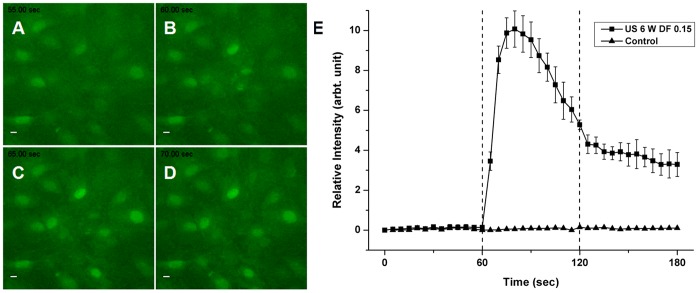
Figure 7. Changes in fluorescence intensities of MC3T3-E1 cells loaded with Calcium GreenTM-1.
Time-lapse sequence images showing calcium influx in the cells before pulsed ultrasound radiation (A), at the start (B) of radiation and during the radiation (C and D). Compared to cells without ultrasound radiation, the pulsed ultrasound evoked a significant increase in intracellular calcium levels (E). Dotted lines represent duration of radiation on- and off-switch, respectively. Scale bar, 10 µm.

