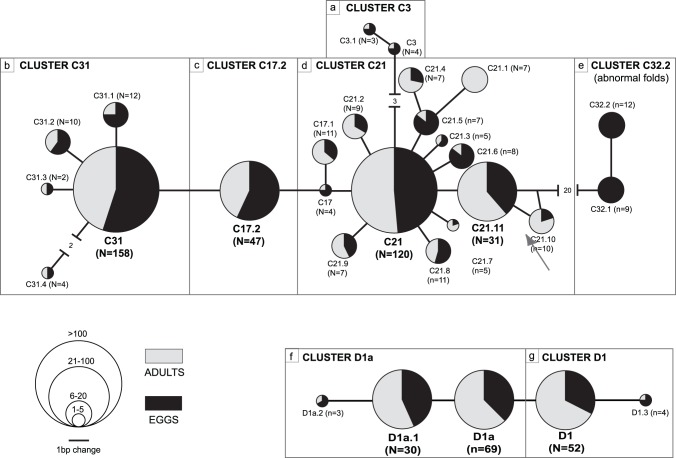
Figure 3. Symbiodinium sequence networks and folding clusters between parents and eggs.
Symbiodinium ITS2 sequences (N = 659 sequences) identified from 64 Montipora capitata coral samples (see Table 1), showing the relationships among the 24 distinct ITS2 sequences retrieved in Symbiodinium clade C, and 5 in Symbiodinium clade D. The pie charts correspond to individual Symbiodinium ITS2 sequences, with the diameter of the pie charts proportional to the number of sequences retrieved corresponding to the circular inset scale (exact numbers given in brackets). Grey and/or black colors correspond to sequences obtained from adult coral colonies and coral eggs, respectively. Networks are subdivided into cluster groupings that each contains sequences with identical secondary structure folding. Details on secondary structures are shown in the Figure S1.

