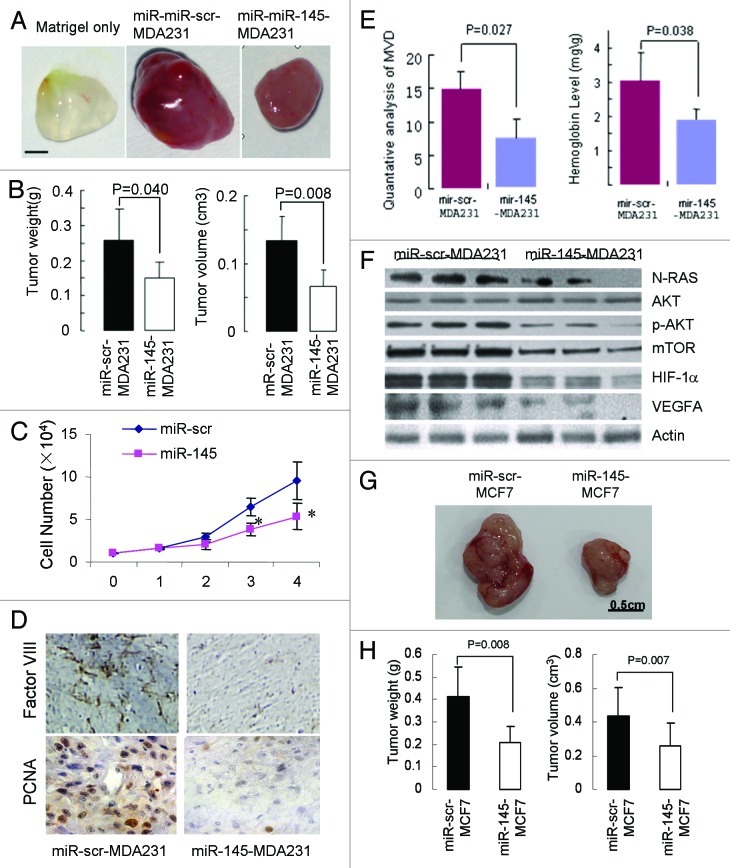
Figure 4. Inhibitory effect of miR-145 on tumor growth and angiogenesis in vivo. (A) Xenograft tumors obtained 20 d after subcutaneous injection of cancer cells. Bar = 2 mm. (B) Quantative analysis of weight and size of tumors (n = 5). (C) Cell proliferation rates of MDA231 cells infected with lenti-miR-scr or lenti-miR-145 were determined by counting cell number for 4 d. *p < 0.05. (D) Immunohistological analysis of tumor tissues using Factor VIII (×40). (E) Quantative microvascular density (MVD) analysis (left) and hemoglobin content level assay (right). The graph represents the mean ± SD from five different tumor sections. The data displayed significant difference of MVD and hemoglobin content between miR-145-MDA231 tumors and the negative control (p < 0.05), indicating miR-145 repressed angiogenesis in the tumors. (F) Immunoblotting analysis of the targets and key signaling molecules in the tumors using antibodies against N-RAS, p-AKT, mTOR, HIF1α and VEGF-A. (G) MiR-scr-MCF7 and miR-145-MCF7 stable cells were used to perform tumor growth assay as above. After 30 d, the tumors were photographed, measured and weighed. (H) Tumor weight and volumes of MCF7 xenografts were presented as mean ± SD (n = 6).

An official website of the United States government
Here's how you know
Official websites use .gov
A
.gov website belongs to an official
government organization in the United States.
Secure .gov websites use HTTPS
A lock (
) or https:// means you've safely
connected to the .gov website. Share sensitive
information only on official, secure websites.
