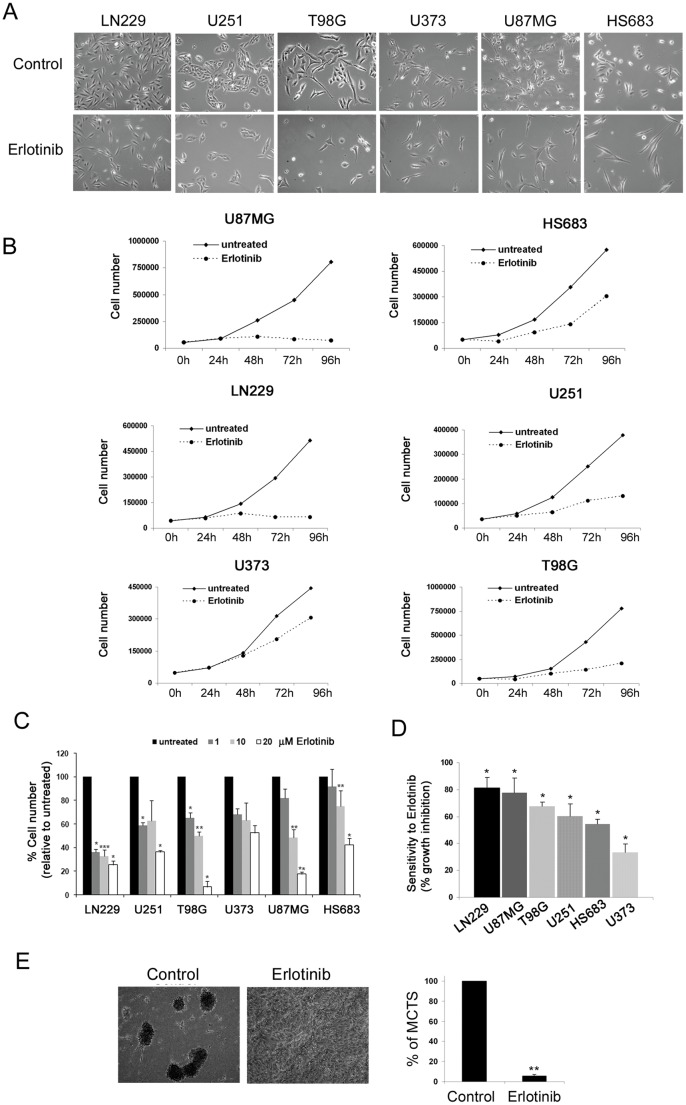
Figure 1. Erlotinib inhibits glioma cell proliferation.
(A) Representative phase-contrast micrographs of glioma cell lines left untreated (control) or treated for 48 h with 10 µM erlotinib (erlotinib). (B) Glioma cell lines were left untreated (untreated) or treated with 10 µM erlotinib (erlotinib) and the number of cells counted every 24 h. Data from a representative experiment out of three repetitions is shown, representing the total number of viable cells in untreated and erlotinib-treated conditions at the indicated time-points. (C) Glioma cell lines were treated for 72 h with the indicated concentrations of erlotinib. The mean ± SD values from three independent experiments, each conducted in duplicate, are shown in the graph, representing the percentage of viable cells relative to untreated conditions. The differences between control and erlotinib treatment are statistically significant (Student's t-test: *P<0.05, **P<0.01 and ***P<0.001, respectively). (D) Glioma cell lines were treated for 72 h with 10 µM erlotinib. Sensitivity to erlotinib of each cell line is expressed as the mean ± SD percentage of growth inhibitory activity from three independent experiments, each conducted in duplicate. The differences between control and erlotinib treatment are statistically significant (Student's t-test: *P<0.05) (E) Representative phase-contrast micrographs of U87MG cells left for 4–6 days to allow formation of multicellular tumour spheroids (MCTS), untreated (control) or treated with 10 µM erlotinib (erlotinib). The graph indicates the mean ± SD values of MCTS formation from three independent experiments, each conducted in duplicate, expressed as the percentage of MCTS relative to untreated cells. The differences between control and erlotinib treatment are statistically significant (Student's t-test: **P<0.01).

