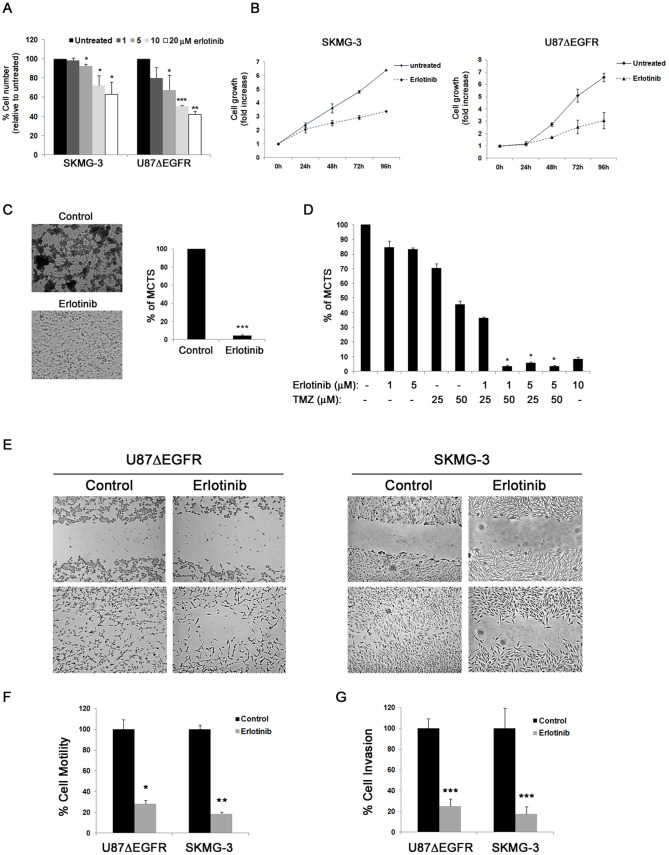
Figure 8. EGFR inhibition is effective in glioma cells with amplified or mutant EGFR.
(A) SKMG-3 and U87ΔEGFR cells were treated for 72 h with the indicated concentrations of erlotinib. The mean ± SD values from three independent experiments, each conducted in duplicate, are shown in the graph, representing the percentage of viable cells relative to untreated conditions. The differences between control and erlotinib treatment are statistically significant (Student's t-test: *P<0.05, **P<0.01 and ***P<0.001, respectively). (B) SKMG-3 and U87ΔEGFR cells were left untreated (untreated) or treated with 10 µM erlotinib (erlotinib) and the number of cells counted every 24 h. The mean ± SD values from three independent experiments, each conducted in duplicate, are shown in the graph, representing the fold increase in cell growth in untreated and erlotinib-treated conditions at the indicated time-points. (C) Representative phase-contrast micrographs of U87ΔEGFR cells left for 6 days to allow formation of multicellular tumour spheroids (MCTS), untreated (control) or treated with 10 µM erlotinib (erlotinib). The graph indicates the mean ± SD values of MCTS formation from three independent experiments, each conducted in duplicate, expressed as the percentage of MCTS relative to untreated cells. The differences between control and erlotinib treatment are statistically significant (Student's t-test: ***P<0.001). (D) U87ΔEGFR cells were left untreated or treated as indicated and grown for 6 days to allow formation of multicellular tumour spheroids (MCTS). The graph indicates the mean ± SD values of MCTS formation from three independent experiments, each conducted in duplicate, expressed as the percentage of MCTS relative to untreated cells. The differences between combined treatments and either treatment alone are statistically significant (Student's t-test: *P<0.05). (E) Representative phase-contrast micrographs of U87ΔEGFR (left panel) and SKMG-3 (right panel) cells left untreated or treated with 10 µM erlotinib as indicated, before (upper panel) and after (lower panel) performing wound healing assays as described in Materials and Methods. (F) Representation of the mean ± SD rate of motility, from three independent experiments performed in sextuplicate, expressed as the percentage of cell motility in each of the indicated conditions relative to untreated cells. The differences between control and erlotinib treatment are statistically significant (Student's t-test: *P<0.05 and **P<0.01, respectively). (G) U87ΔEGFR and SKMG-3 cells were seeded onto Matrigel-coated transwells in the absence or presence of 10 µM erlotinib to perform invasion assays as described in Materials and Methods. The graph represents the mean ± SD rate of invasion from three independent experiments performed in duplicate, expressed as the percentage of invasion relative to untreated cells. The differences between control and erlotinib treatment are statistically significant (Student's t-test: ***P<0.001).

