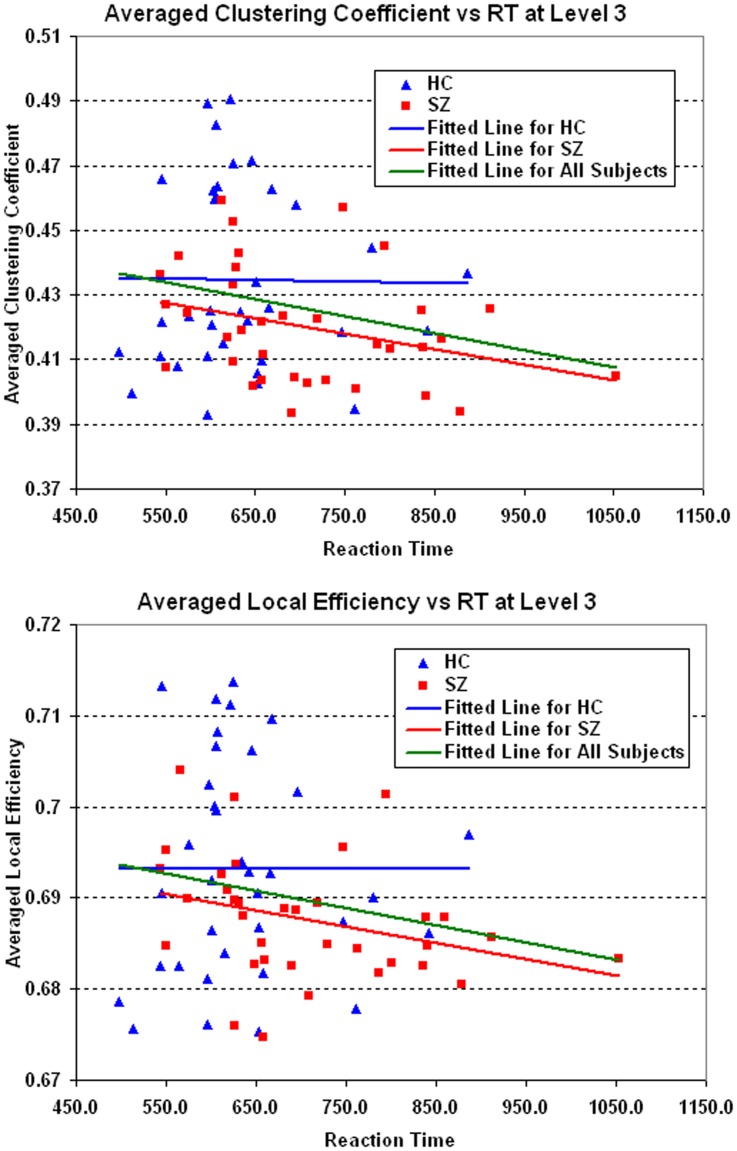
Figure 8. Scatter Plots of averaged clustering coefficients and local efficiency against RT at medium load.
Scatter plots with trend lines showing averaged Cnet and Elocal,net as function of reaction time in all subjects and each group. Significant negative correlation (p<0.05) was found between reaction time and averaged Cnet and Elocal,net for all subjects (green line).

