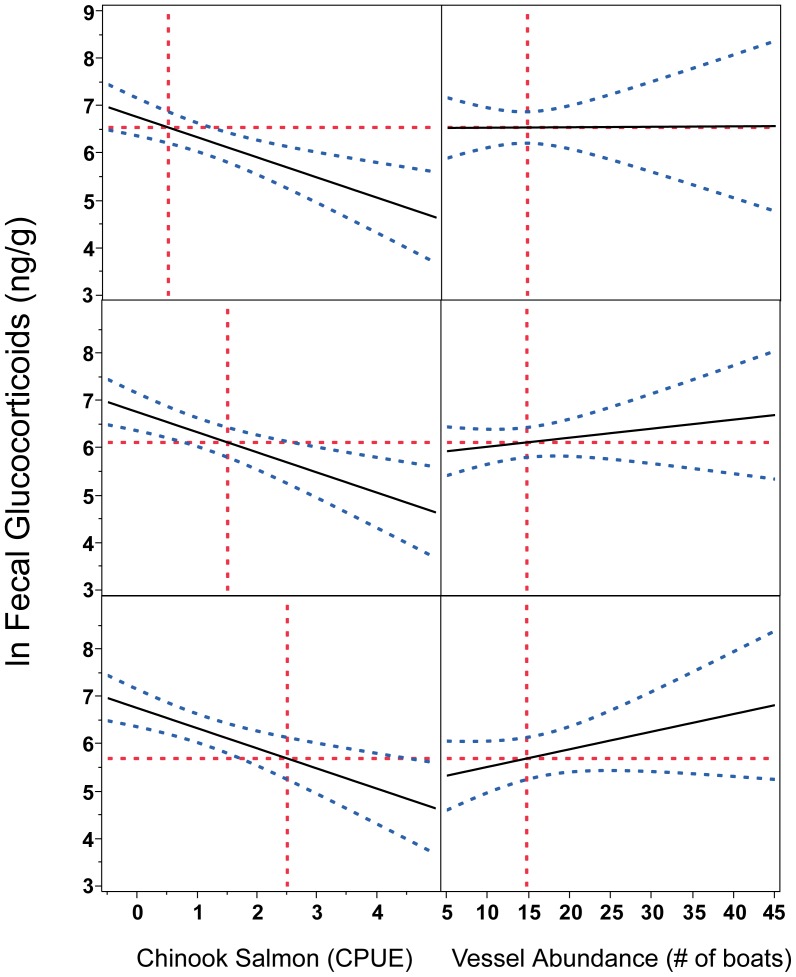
Figure 2. Physiological stress correlates with year, Chinook availability, vessel abundance and an interaction between Chinook and vessel abundance.
According to the best-fit mixed effects model, glucocorticoid concentrations decreased with increased Chinook salmon CPUE, after taking into account a 10-day lag time for fish to swim from the study site to the test fishery (column A). The best-fit model also includes an interaction between Chinook counts and vessel abundance on glucocorticoids, whereby fecal glucocortiods are always high at times of low Chinook counts. However, an increase in glucocorticoids with increasing vessel abundance is observed only during times of relatively high Chinook counts (column B set to the Chinook value indicated by the vertical line in the corresponding panel of column A). The y-axis represents glucocorticoid concentration marginal means predicted from the best-fit model. The hashed blue lines indicate 95% confidence intervals. Vertical red dotted lines indicate Julian day 230 (August 18), the time of maximum vessel traffic and approximately ten days before the maximum Chinook salmon catch each year. Horizontal red dotted lines indicate dependent variable marginal means for each year on day 230 within the model.

