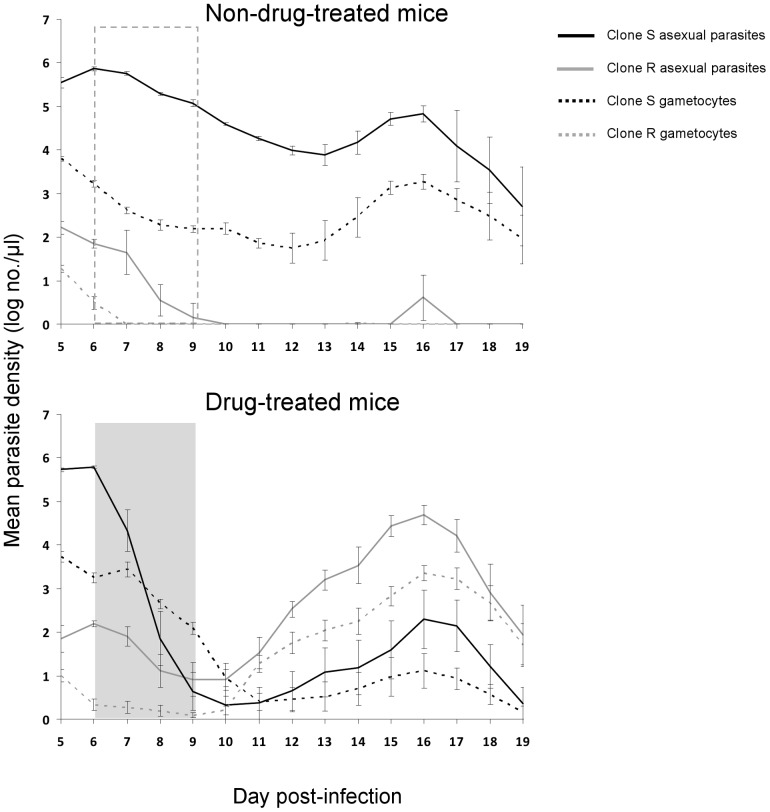
Figure 1. Densities of asexual parasites (solid lines) and gametocytes (dotted lines) of drug-sensitive (clone S, black) and drug-resistant (clone R, gray) parasites within sham-treated (top panel) and drug-treated (bottom panel) mice.
Dashed and shaded boxes show days of sham or drug treatment. Data are log-transformed geometric means (± S.E) of a maximum of 10 mice (number of untreated mice [top panel] reduced to six by day 12 due to morbidity-driven euthanasia).

