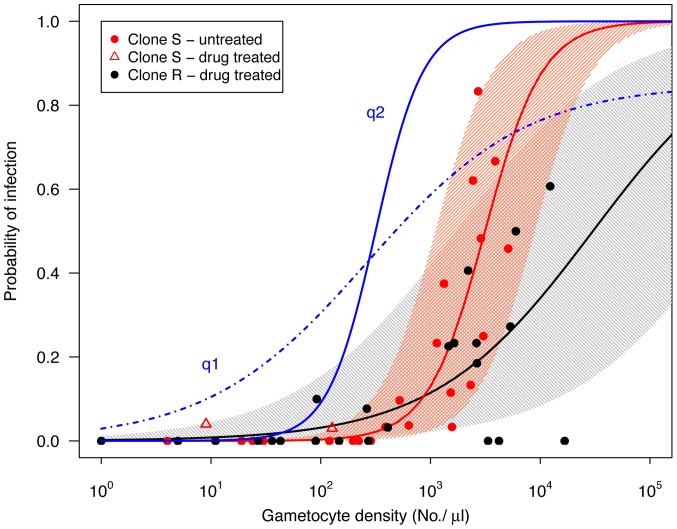
Figure 5. Relationship between gametocyte densities in mice at the time of a blood feed and the subsequent prevalence of infection in mosquitoes fed on those mice for untreated infections with transmission of clone S (red points) and for drug-treated infections with transmission of clone R (black points).
The thick red and black lines show the predicted probability of mosquito infection based on logistic regression (eq 1), and the shaded areas show the 90% prediction intervals (note that these are not confidence intervals, see text for details). Two oocysts consisting of clone S were observed in drug treated infections (open red triangles), these were not included in the model (see text). Blue lines are gametocyte density-infectivity functions (of the form q = αN β/[1+ γN β]) estimated from P. falciparum data compiled by Carter and Graves [66] and Barnes & White [67]: q1 (dot-dashed blue line;α = 0.03, β = 0.6, α/γ = 0.85) and q2 (solid blue line; α = 1·10−5, β = 2, α/γ = 1) as presented by Huijben et al. [34].

