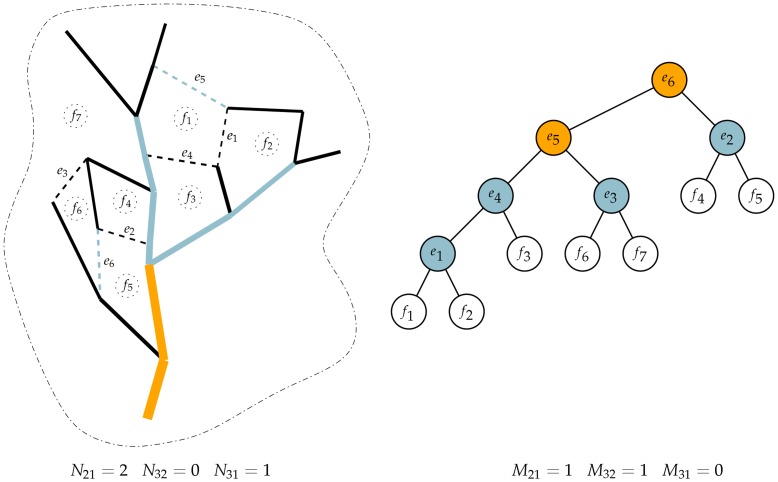
Figure 3. Example of hierarchical levels.
The levels are assigned to the loops and branches of the network from Fig. 1C. Edge levels are shown on the left, where black edges have order 1, light blue edges have order 2 and gold edges have order 3; reticular edges are dashed. Face levels are shown in the co-tree on the right, where white nodes have order 1, light blue nodes have order 2 and gold nodes have order 3. Leaves of the co-tree are labeled by the corresponding faces while other nodes are labeled by the reticular edges causing the merger of the two child nodes. Numbers  are Tokunaga statistics for the spanning tree and indicate the number of edges of level j joining with edges of level i
[43]. Similarly,
  are Tokunaga statistics for the reticulate co-tree and indicate the number of edges and faces of level j merging with edges of level i. For both M and N, statistics are only collected when
  .
.

