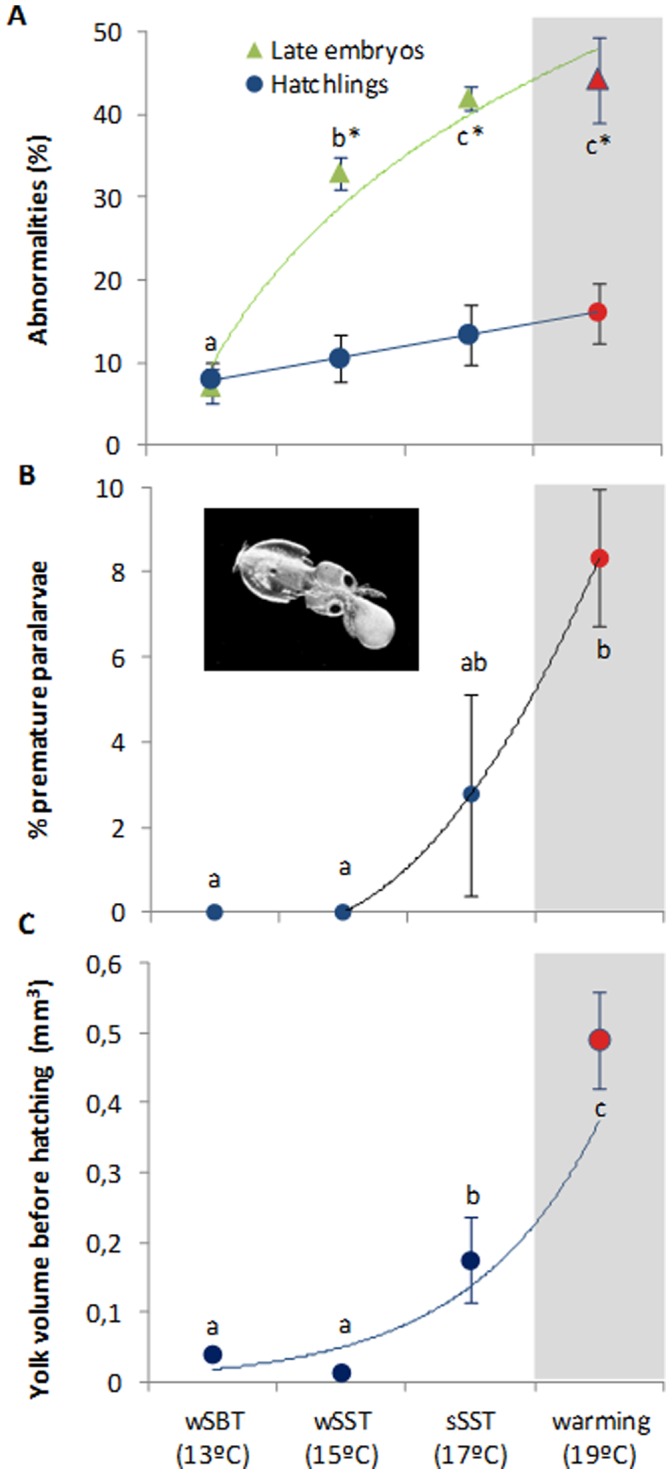
Figure 3. Abnormalities and premature hatching in the squid, Loligo vulgaris.

Percent of total abnormalities (%) in late embryos and hatchlings (A), percentage of premature paralarvae (B), and yolk volume in late embryos (mm3)(C) at the different temperature scenarios (red symbols highlight the future summer scenario). Values are mean ± SD. Colored lines represent trendlines. In the upper panel, different letters and asterisks represent significant differences between temperatures and developmental stages, respectively (two way-ANOVA, more statistical details in Supporting Tables). In the middle and lower panels different letters represent significant differences (one-way ANOVA; more statistical details in Supporting Tables).
