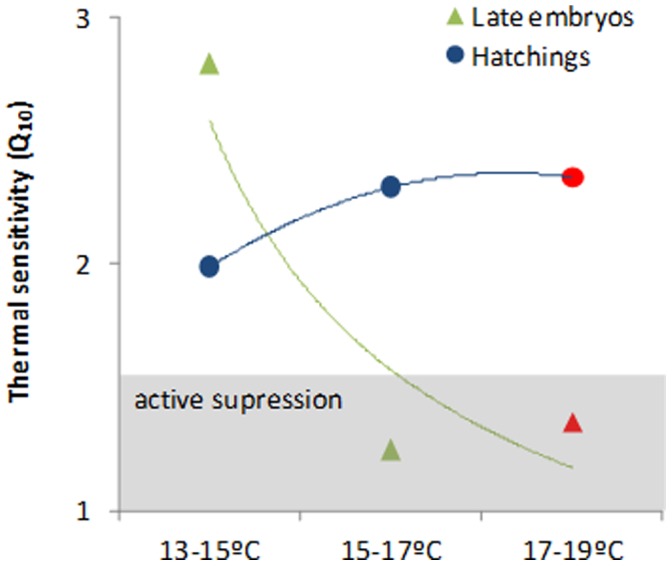
Figure 5. Thermal sensitivity (Q10) of late embryonic stages and hatchlings of Loligo vulgaris at the different temperature scenarios (red symbols highlight the future summer scenario).

Coloured lines represent trendlines. Q10 values between 2 and 3 indicate active metabolic regulation; Q10 values inferior to 1.5 suggest active metabolic suppression.
