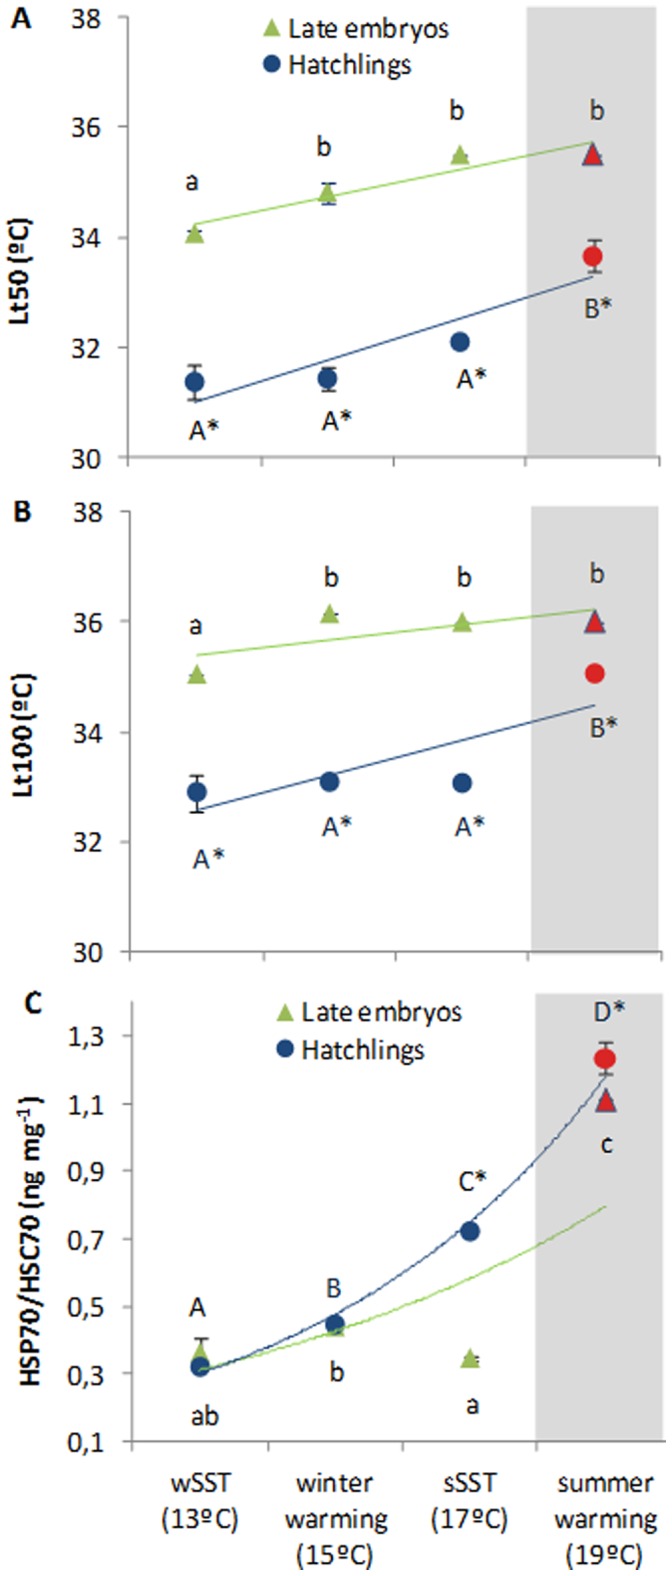
Figure 6. Thermal tolerance limits (A - Lt50, °C; B - Lt100, °C) and heat shock response (HSP70/HSC70, ng mg−1) (C) of late embryonic stages and hatchlings of the squid Loligo vulgaris at the different temperature scenarios (red symbols highlight the future summer scenario).

Values are mean ± SD. Colored lines represent trendlines and different letters (capital letters for hatchlings; small letters for embryos) and asterisk represent significant differences between temperatures and developmental stages, respectively (more statistical details in Supporting Tables).
