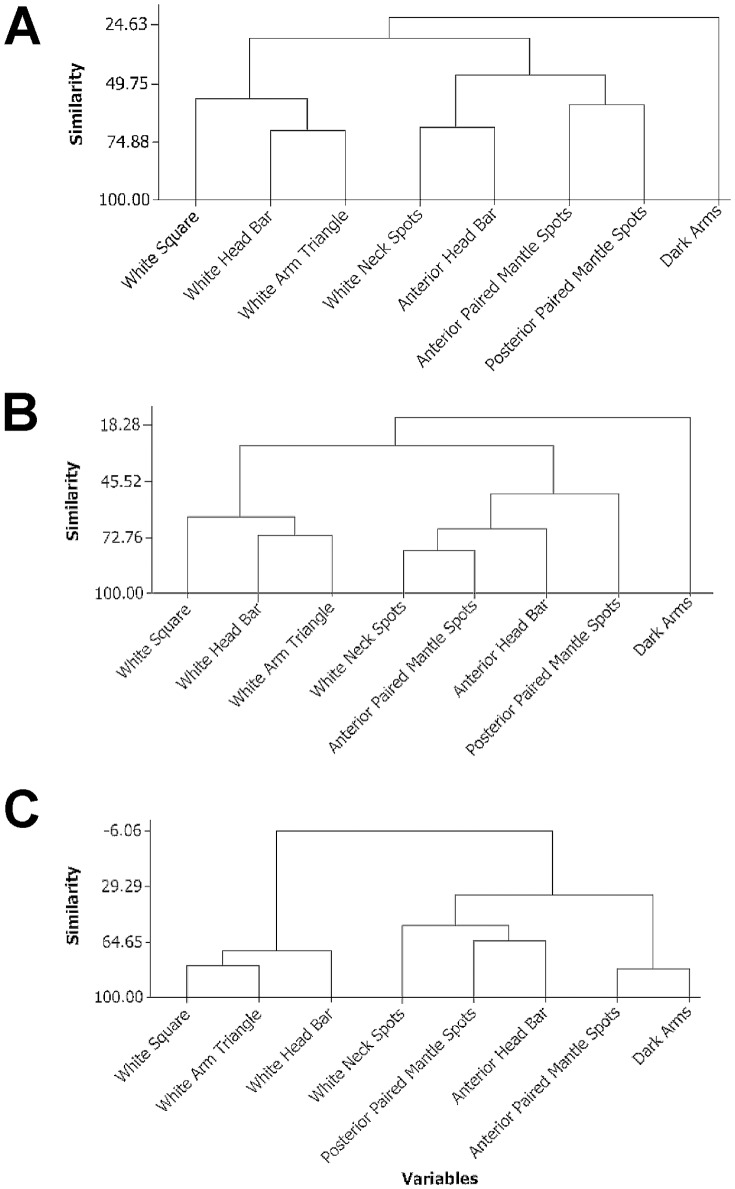
Figure 3. Dendrograms showing correlation coefficient distance (Ward Linkage) between body patterning components during the putative sleep-like state+CA in three adult/senescent cuttlefish (A: “C-check”; B: “Tiny”; C: “KY”).
Dendrogram similarity scores range from 100% to −100% and are equivalent to Pearson or Spearman R values of “1” or “−1”.

