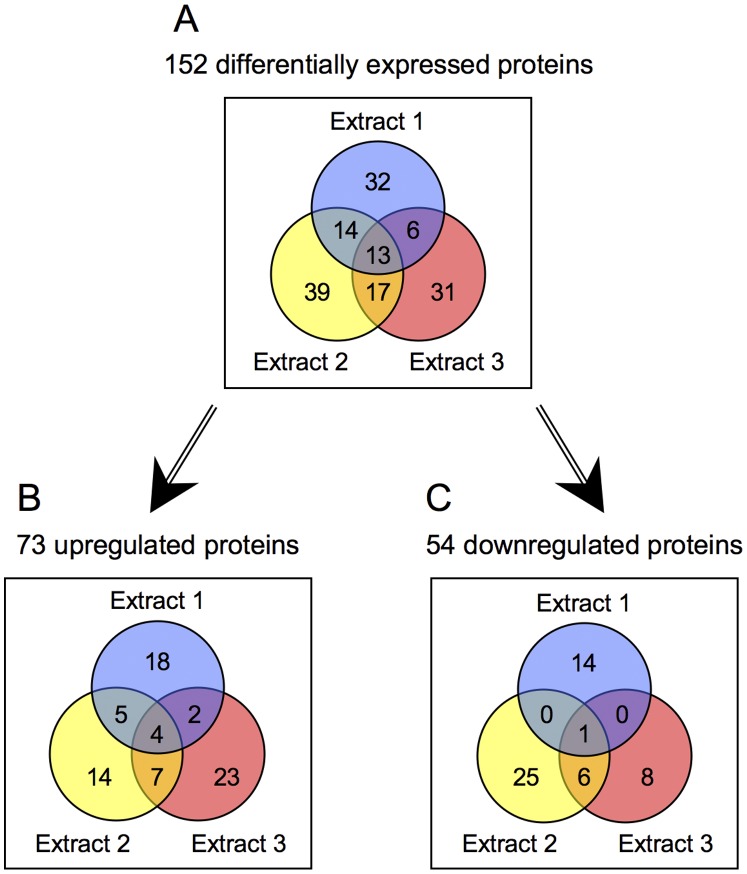
Figure 4. Venn diagrams showing the numbers of differentially expressed proteins identified in Extracts 1–3 over the three biological replicates of the experiment, comparing biofilm to planktonic organisms.
The three extraction conditions progressed from the least stringent (Extract 1, 30 mM Tris buffer) to the most stringent (Extract 3, 2% SDS) so as to capture as many different classes of proteins as possible. All proteins represented had quantitation p-values <0.05 and met the 1.5-fold cutoff threshold for differential expression. The diagrams show (A) all differentially expressed proteins, (B) upregulated proteins, and (C) downregulated proteins. Twenty-five of the 152 proteins represented in panel A exhibited variable expression trends across Extracts (see text).

