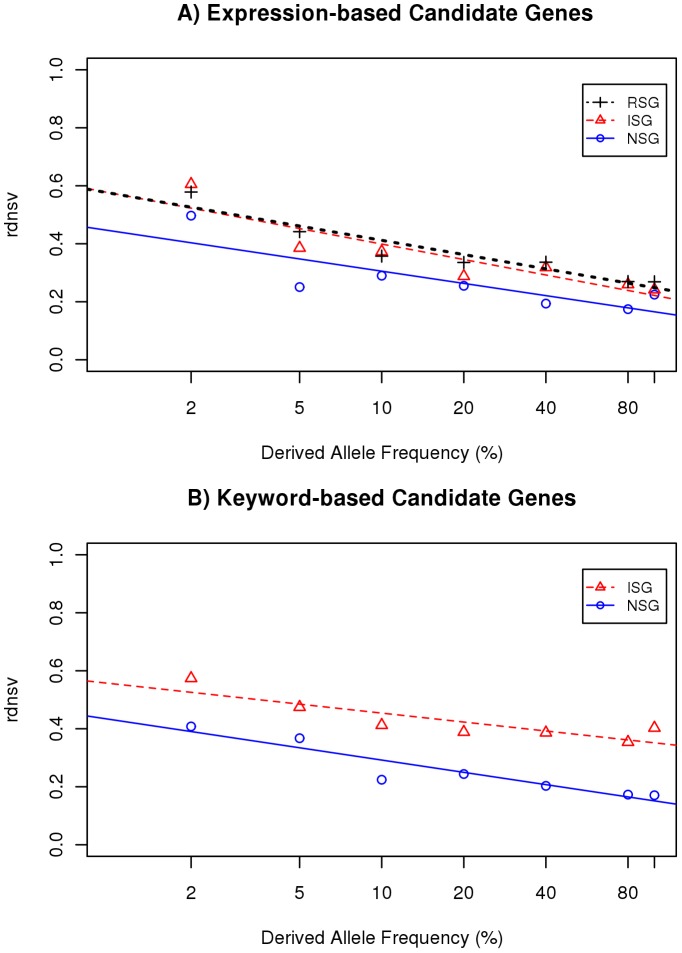
Figure 3. Estimates of rdnsv over different allele frequency bins.
The estimates of rdnsv decrease with SNV allele frequency in all gene categories. The slope of the fitted regression model can be interpreted as a measure for the influence of purifying selection on segregating nsSNVs. The y-intercept (rdnsv0) can be interpreted as the proportion of nsSites where mutations are tolerated to segregate with an allele frequency notably greater than 0. A) Expression-based NSGs (circles), ISGs (triangles) or RSGs (crosses). The fitted models are rdnsv(NSG) = 0.45−0.061×; rdnsv(ISG) = 0.58−0.079× and rdnsv(RSG) = 0.58−0.071×B) Keyword based NSGs (blue) and ISGs (red). The fitted models are rdnsv(NSG) = 0.43−0.061×; rdnsv(ISG) = 0.58−0.045×.

