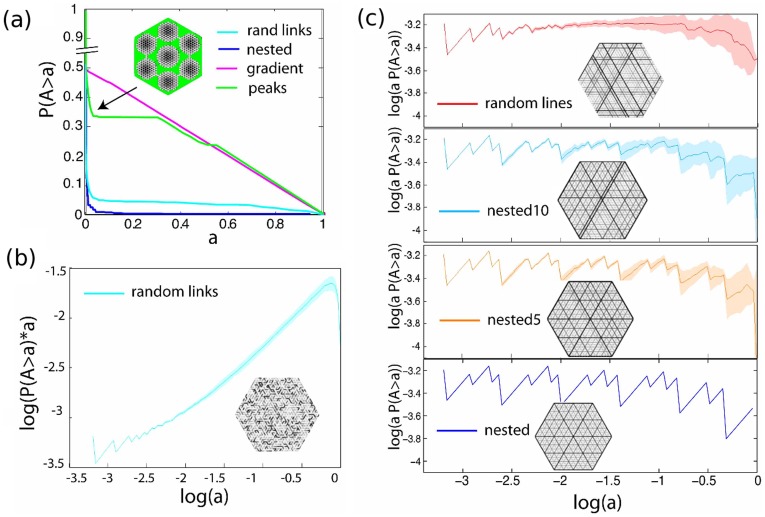
Figure 6. Cumulative size distribution of generated graphs.
These graphs were constructed to share identical underlying topology (N = 817 vertices, triangular lattice) and edge width distribution. (a) The asymmetry  of the random lines model (red) and random links model (cyan). The x-axis is the logarithm of the degree of the vertex or the nesting tree. Red line: averaged asymmetry of subgraphs of degree
  , random lines model. Cyan line: averaged asymmetry of subgraphs of degree
  , random links model. Inset: Density plots: The overlap of the two distributions is plotted in white. (b) The averaged asymmetry
  of the nested (blue), nested5 (orange), nested10 (light blue), random lines (red) and random links model (cyan) as a function of the base 2 logarithm of the degree d. (c) Cumulative size distribution
  of generated models. Random links model (green), nested (blue), gradient (magenta), peaks (green). The total area of the graphs has been normalized to 1. Discontinuities or near discontinuities in the slope of cumulative size distribution indicate lengthscales where potentially the architectural organization changes qualitatively. (f1). Adjusted cumulative size distribution, random links model. (f2) The Adjusted cumulative size distribution
  is plotted for the nested (blue), nested5 (orange), nested10 (light blue) and random lines model (red).The Adjusted cumulative size distribution of the self-similar networks (nested, nested5, and random lines) can be approximated by a straight line of slope zero. Notice the periodicity in the nested lines model. The colored area indicates the standard error of 20 realizations.

