
Figure 7. Asymmetry and cumulative size distribution of optimized graphs.

(a) Optimized networks, fluctuations in the load (sink model). Instances of optimized graphs ( ) when the load is concentrated at a single, moving, point. (b) Optimized networks, robustness to damage (bond model). Instances of optimized graphs (
 ) when robustness is required under the presence of random damage. (c) Asymmetry of sink model. (d) Asymmetry of bond model. The average asymmetry
  is plotted as a function of the normalized subtree degree
  . Red line:
  . Green line:
  . Blue line:
  . Black dashed line: random links model. The colored area represents the standard error after averaging over 20 realizations of each model. (e) Adjusted cumulative size distribution, sink models. The gray line overlayed on the blue,
  line is the random links model. (f) Adjusted cumulative size distribution, bond models. The adjusted cumulative size distribution
  is plotted for
 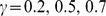 (red, green, blue respectively) The adjusted cumulative size distribution is averaged over 20 realizations for the bond, sink and random edges model. The colored area represents the standard error after averaging over 20 realizations of each model.