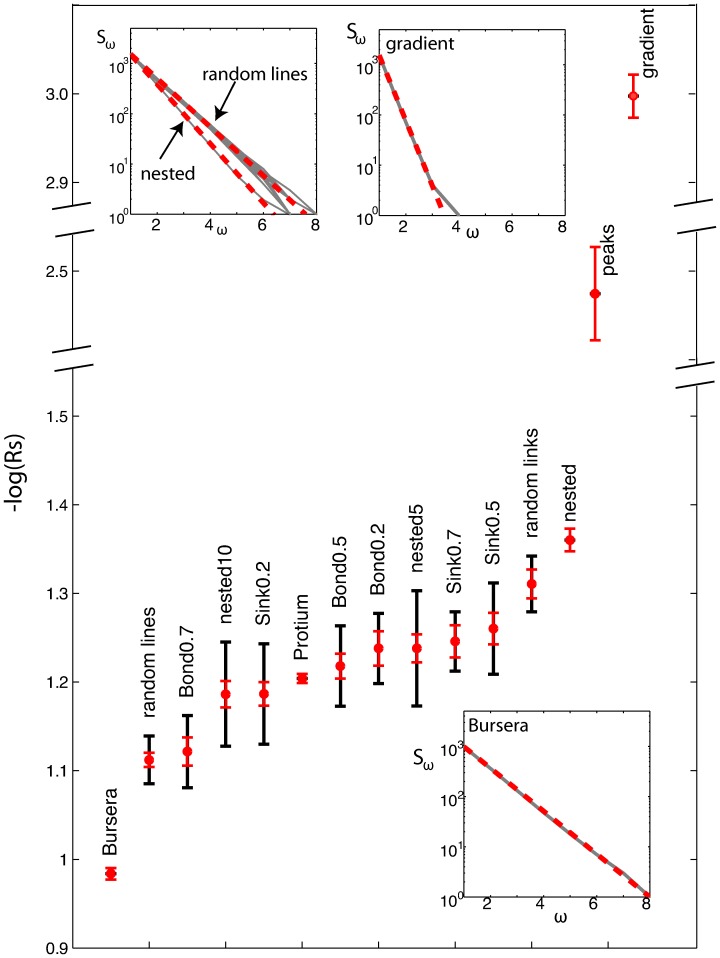
Figure 10. Strahler bifurcation ratio for the various generated, optimized and natural graphs.
Red error bar: standard error of the linear regression fit (represents goodness of linear fit). Black error bar: standard deviation of the logarithm of the bifurcation ratio (average over 20 realizations). Insets: Number of Strahler streams  of order
  as a function of
  for the random lines, nested and gradient model and the Bursera leaf. Note that in each case, the
  follows closely an inverse geometric progression with
  (shown with the red dashed line).

