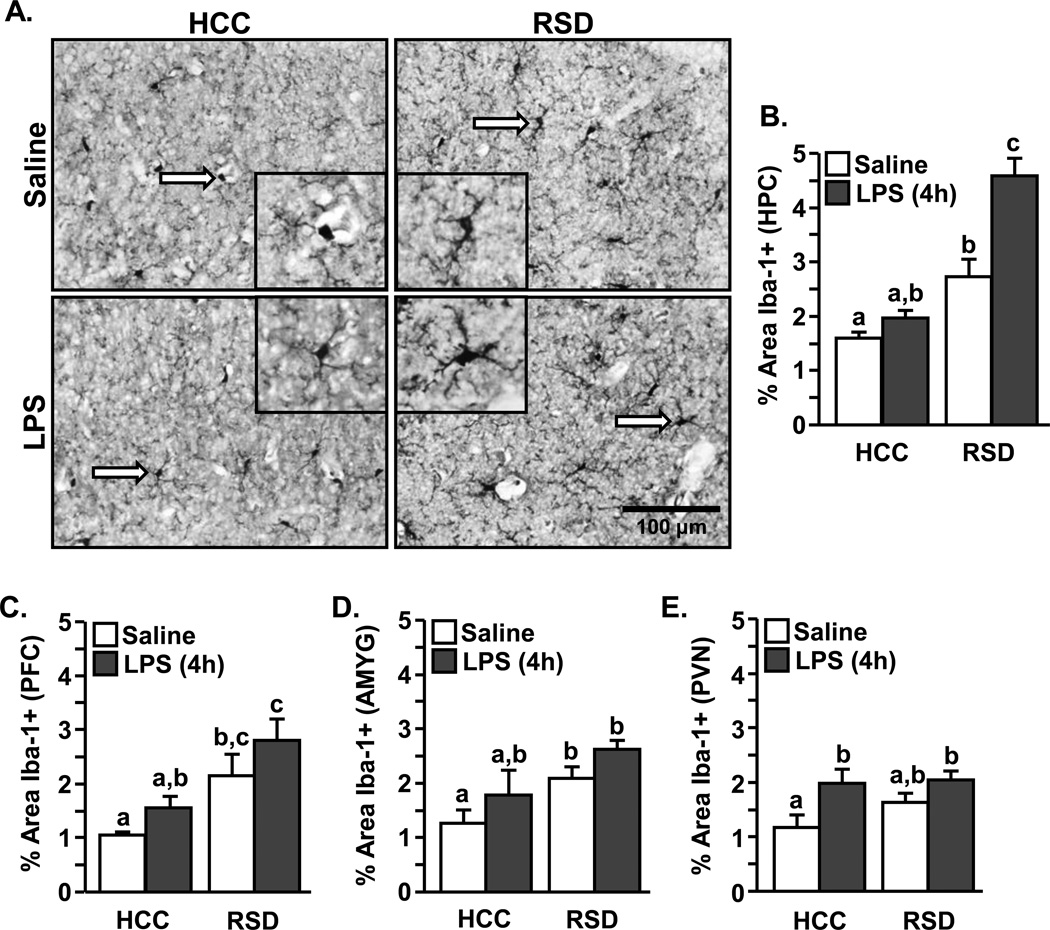
Figure 3. Enhanced microglia activation in the HPC of socially defeated mice injected with LPS.
Male C57BL/6 mice were subjected to repeated social defeat (RSD) or left undisturbed as controls (HCC). Fourteen hours after RSD, mice were injected with saline or LPS (0.5 mg/kg). A) Representative images of Iba-1 staining in the hippocampus of brains collected 4 h after injection (40×). Inset includes enlarged image of Iba-1+ cell indicated by white arrow. B–E) Proportional area for Iba-1 staining in the B) hippocampus (HPC), C) pre-frontal cortex (PFC), D) amygdala, and E) paraventricular nucleus (PVN) (n=3–5). Bars represent the mean ± SEM. Means with different letters (a, b, or c) are significantly different (p<0.06) from each other.

