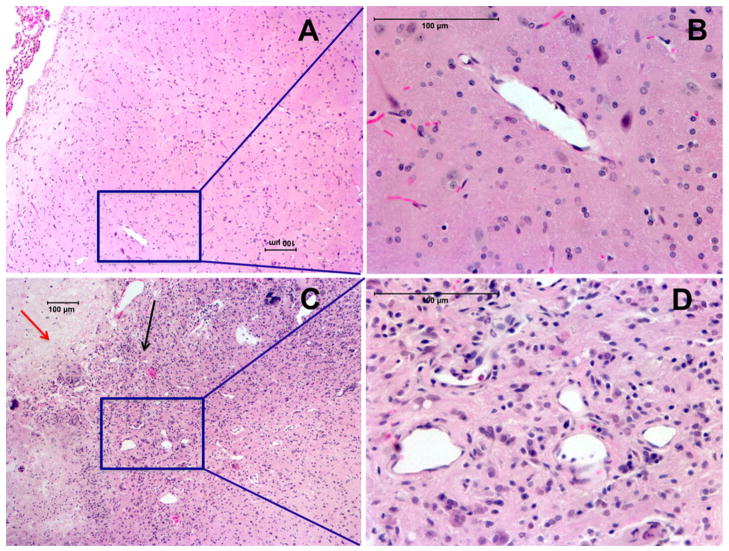
Fig. 6.
H&E staining showing radiation-induced tumor necrosis (red arrow) along with viable tumor (black arrow) surrounded by necrosis in brain (c). Higher magnification of the necrotic region in brain revealed extensive angiogenesis and telangiectasia (d). Contralateral side without necrosis showed normal looking blood vessels (a–b)

