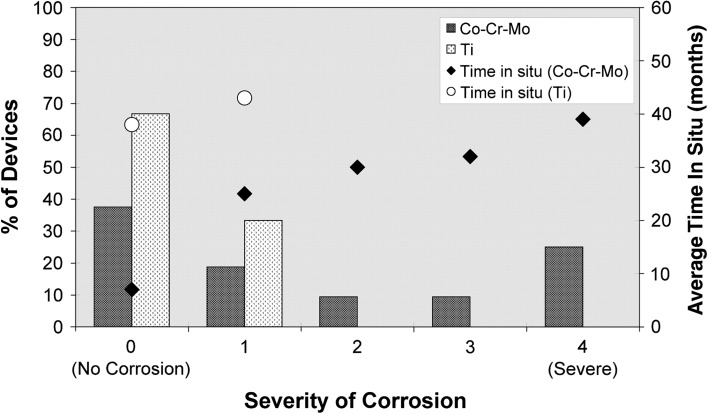
Fig. 3.
A graph shows severity of corrosion of Co-Cr-Mo and Ti devices as a function of percentage of devices showing no corrosion (severity of 0) through to severe corrosion (severity of 4). Time in situ for the Co-Cr-Mo and Ti devices is depicted on the second y axis. Despite a shorter implantation time, a greater degree of degradation is seen in the Co-Cr-Mo devices than in the Ti-based devices.

