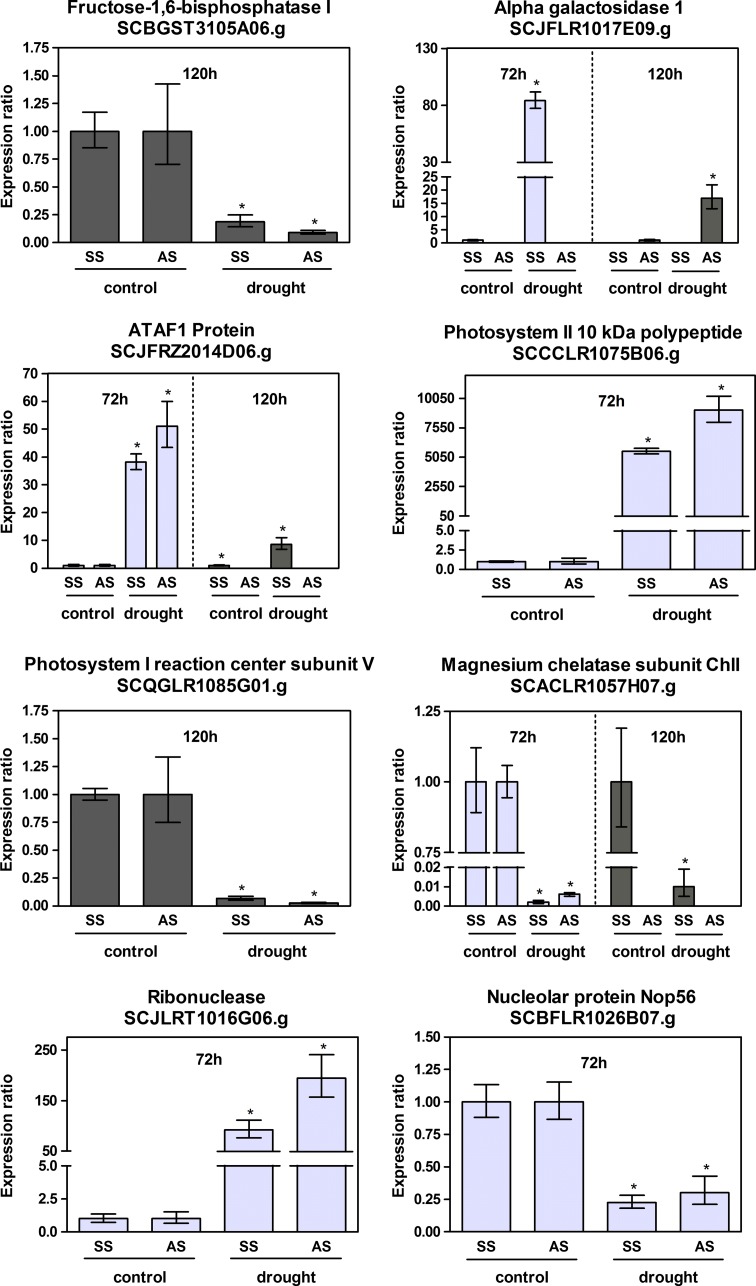
Fig. 5.
qPCR of sense and antisense transcripts regulated by drought stress. The y axis is the normalized relative expression ratio between stressed versus irrigated samples. qPCR reactions were done only for experimental points differentially expressed in microarray experiments. Reactions were done in triplicates; on a third biological replicate and using strand specific cDNA as template. Error bars were calculated as in Rocha et al. (2007). *p = 1.00 for control versus drought sample

