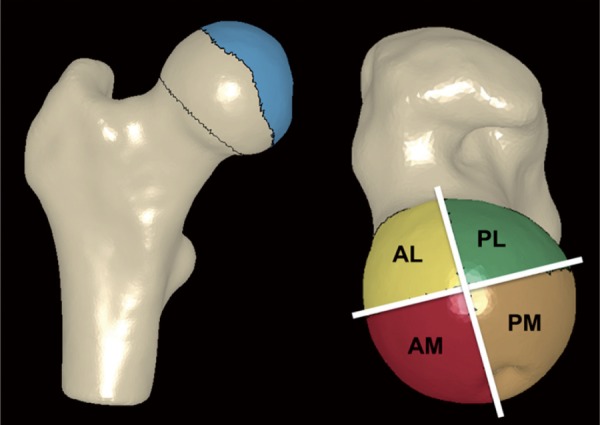
Figure 2.

3D reconstruction of femur from CT image data from a control subject.
Left: The femur head-neck junction was defined automatically (line at head-neck junction). The region of femoral head that was covered (blue) was determined by projecting the rim of the acetabulum to the femur (line representing boundary of covered region in blue).
Right: Two planes were created at the center of the femoral head (white) to divide the head into four anatomical regions. A = anterior, P = posterior, M = medial, and L = lateral. Each region includes the portion of the head from the most superior aspect to the femoral head/neck junction inferiorly.
