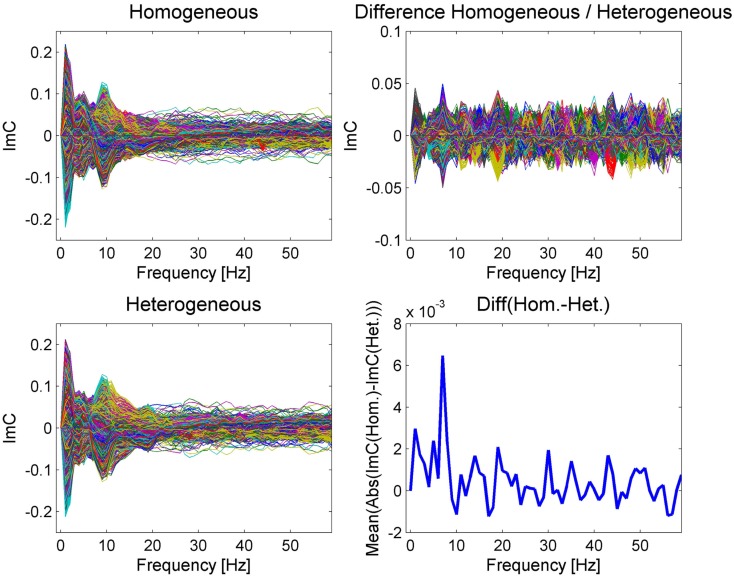
Figure 3.
The imaginary part of coherency is represented as a butterfly plot over frequency for the two different conditions on the left and for their difference on the upper right. The plot of the mean absolute value of the ImC over all channel differences (bottom right) reveals a prominent peak at 7 Hz, which is less visible in the individual condition plots due to overlapping modulations common to both conditions. Please note that the ImC is an antisymmetric measure meaning that the ImC of channel A to channel B equals minus the ImC of channel B to channel A.

