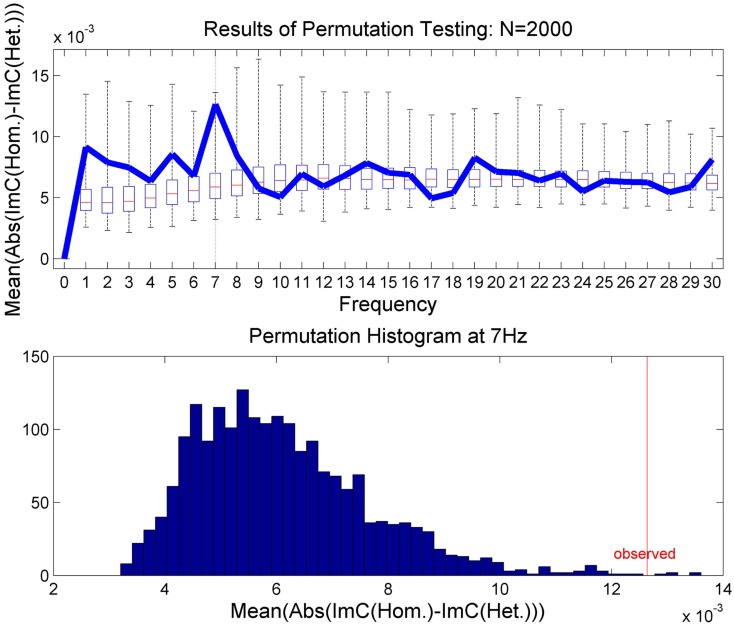
Figure 4.
The results of the permutation test. In the upper plot the results are presented for 1 Hz ≤ f ≤ 30 Hz as box plots showing the median and upper and lower quartiles. The whiskers indicate all permutation results outside of the quartiles. The results of the true class memberships are displayed in blue. The lower plot shows histogram of the permutation results for 7 Hz only.

