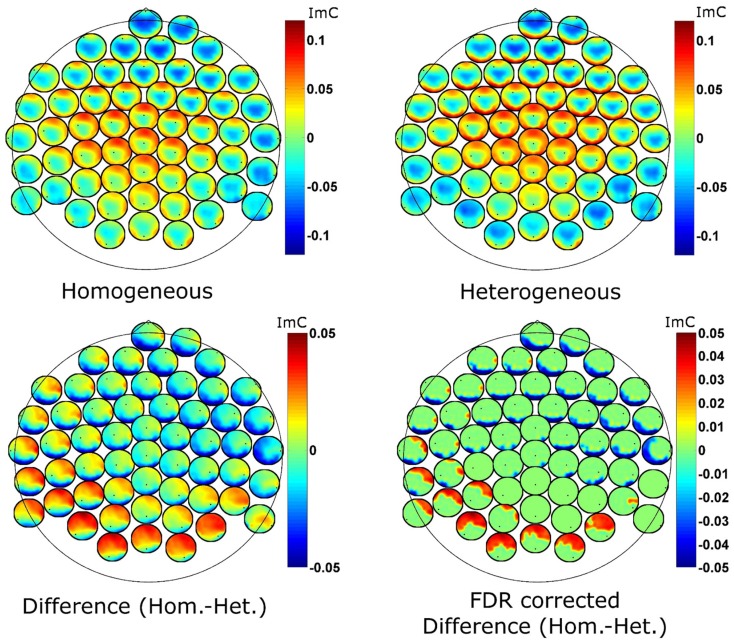
Figure 5.
Head-in-head plots for the imaginary part of coherency at 7 Hz for the two conditions (top row) and for their difference (bottom left). The bottom right graph reports the FDR corrected p-values for the ImC difference (p = 0.1 after correction). The tiny black dots represent the position of the reference electrode in terms of connectivity. Hot as well as cold colors code strong connectivity.

