
Figure 6. Evolution of the concentration of positive cells after an imperfect sorting.
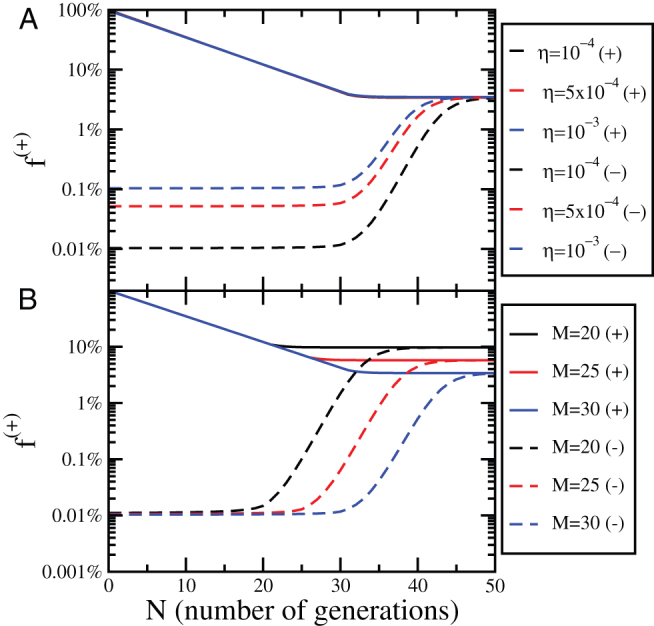
(A) The evolution of the concentration of positive cells after sorting for positive (+) and negative (−) subpopulations as a function of the number of generations N for different values of the sorting efficiency η. The dynamics is obtained solving the CSC model with M = 30 and  . (B) The same plot as panel (A) for η = 10−4 and different values of M.