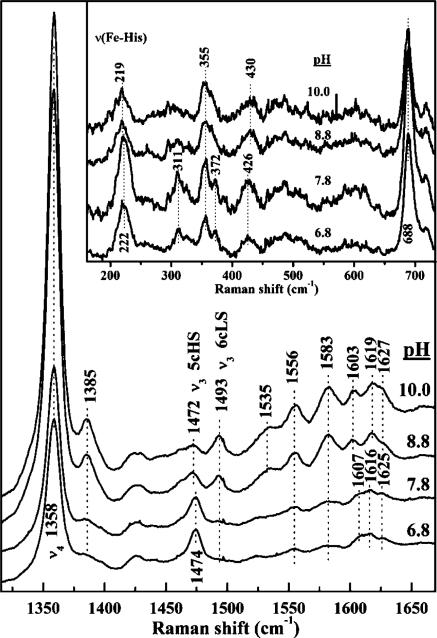
Figure 5.
pH dependence of the high-frequency rR spectrum of ferrous DaCld(R183K). Samples were prepared in 100 mM sodium phosphate at pH 6.8, 100 mM Tris-HCl at pH 7.8, 100 mM Tris-HCl at pH 8.8, or 100 mM Ches at pH 10.0 and reduced with sodium dithionite. Spectra were acquired with 406.7 nm excitation and 18 mW power at the sample. The inset shows the pH dependence of the low-frequency window of the rR spectrum of ferrous DaCld(R183K) obtained with 441.6 nm excitation.

