
Figure 4.
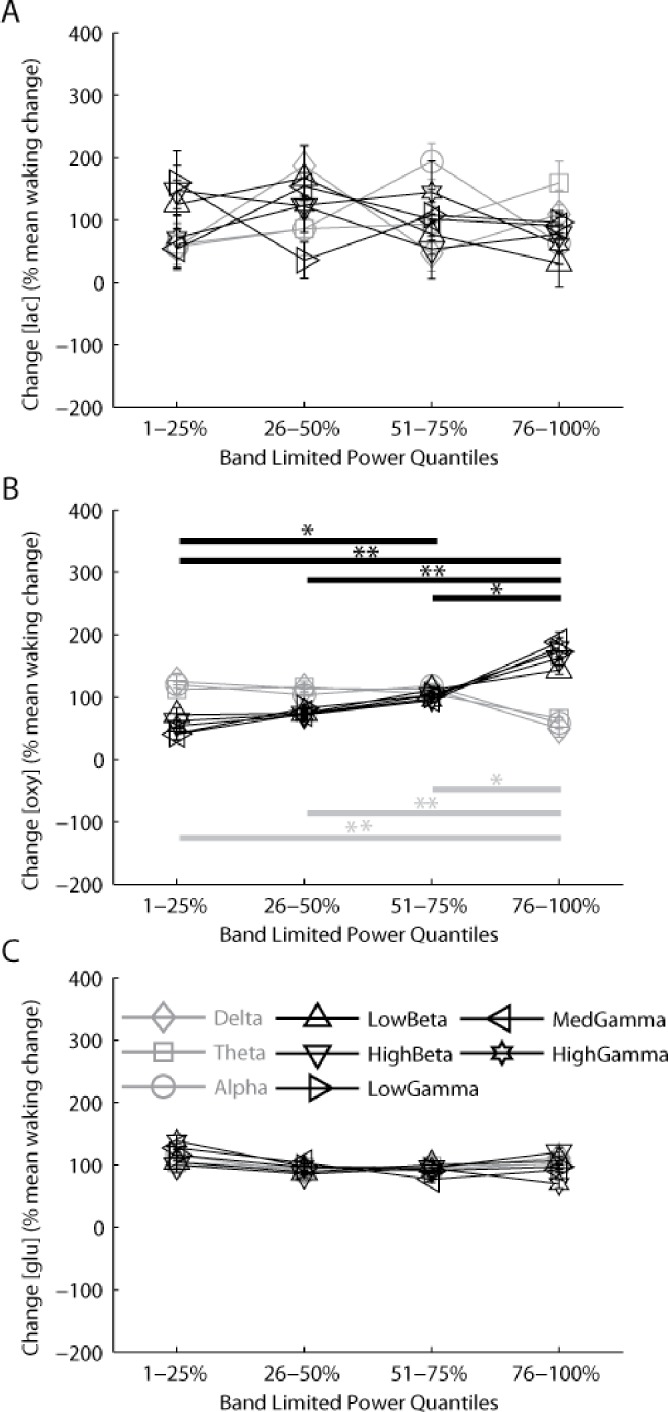
[Oxy] changes in association with the amount of high- and low-frequency electroencephalographic (EEG) band-limited power (BLP; an index of cortical activity), whereas [lac] and [glu] show no relationship with BLP at any frequency. BLP was calculated for every 4-sec epoch of wake in 3 lower frequency windows (gray lines); Delta (0.5-4Hz), Theta (5-9Hz), Alpha (10-18Hz) and 5 higher frequency windows (black lines): LowBeta (22-30), HighBeta (30.25-40Hz), LowGamma (40.25-59Hz), MedGamma (61-80Hz), HighGamma (80.25-100Hz). Changes in [lac] (A), [oxy] (B), and [glu] (C) during each 4-sec epoch of wake were binned across 4 quartiles of increasing power within each frequency band and are presented as mean ± standard error of the mean. Post hoc testing for lower frequencies (0.5-18 Hz) and higher frequencies (22-100 Hz), Fisher least significant difference: *P < 0.05; **P < 0.01. Glutamate results were derived from data previously collected by Dash et al.18