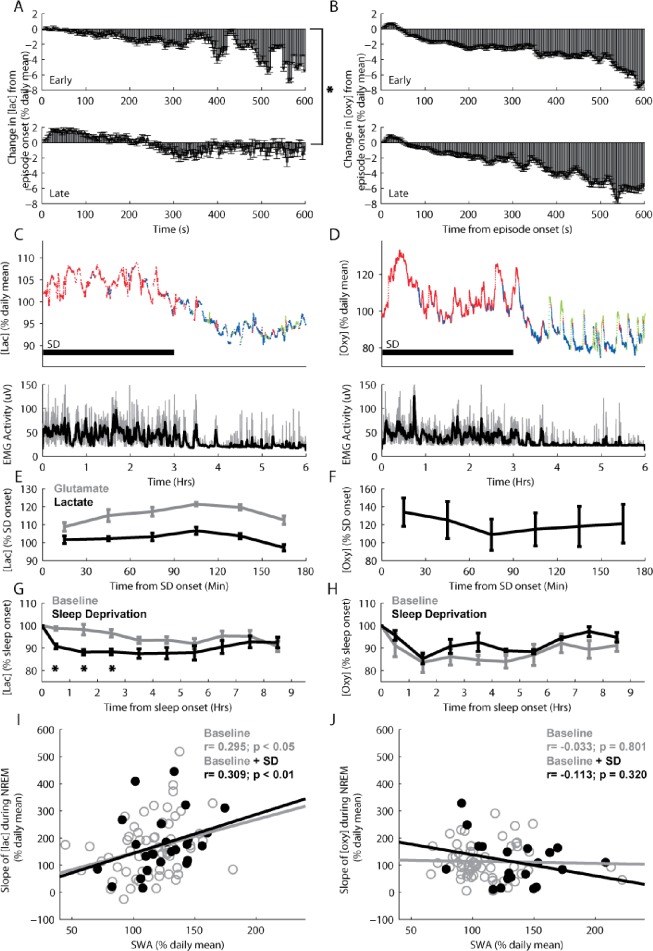
Figure 5.
During both spontaneous and recovery nonrapid eye movement (NREM) sleep after sleep deprivation, increased sleep pressure is associated with larger declines in [lac], whereas [oxy] does not change in association with sleep pressure. Average changes in [lac] (A) and [oxy] (B) during episodes of early (hr 1-4 after lights onset) and late (hr 8-12 after lights onset) spontaneous NREM sleep. (C and D) Top panels: average [lac] and [oxy] for each 4-sec epoch of wake (red), NREM sleep (blue), and REM sleep (green) during 3 hr of sleep deprivation and ensuing 3 hr of recovery sleep in individual rats. Bottom panels: electromyographic activity is depicted for each 4-sec epoch (gray) along with a 1-min moving average overlay (black). (E and F) Average [lac], [glu], or [oxy] (n = 5 each) across the 3-hr sleep deprivation. Concentrations were averaged across 30-min bins and plotted at the middle time point for each bin. (G and H) Average [lac] and [oxy] (relative to sleep onset) during the first 9 hr from light onset (baseline days) and during the first 9 hr after the end of sleep deprivation (n = 5 rats each). Concentrations were binned and averaged across 1-hr intervals and plotted at the middle time point for each bin. (I and J) The relationship between the rates of decline in [lac] and [oxy] and slow-wave activity (SWA) during NREM sleep following either undisturbed baseline (empty gray circles; n = 10 rats each) or sleep deprivation (filled black circles; n = 5 rats each). SWA and analyte concentrations were binned and averaged for 2-hr intervals across the light period. *P < 0.05. Glutamate results were derived from data previously collected by Dash et al.18

