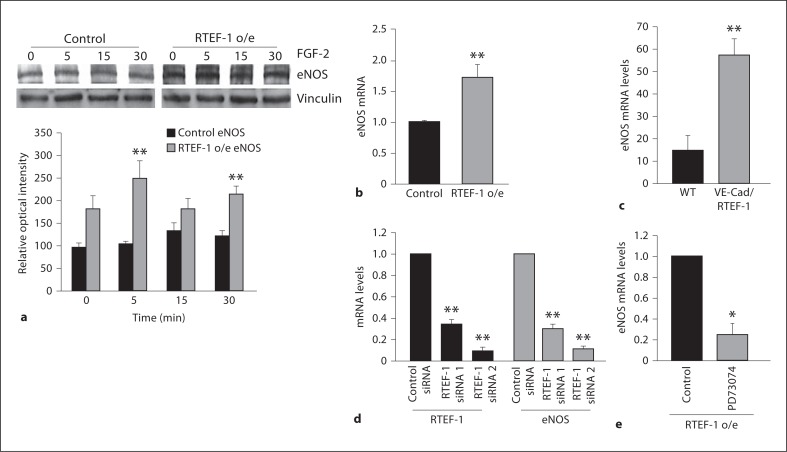
Fig. 6.
RTEF-1 overexpression increases eNOS signaling. a Control and RTEF-1 o/e HMEC-1 cells were treated with FGF-2 (25 ng/ml) for the times indicated and immunoblotted with total eNOS antibodies. Relative optical intensity of the total eNOS of the immunoblot is shown on the bottom panel. b Assessment of eNOS levels by QPCR in stably transfected RTEF-1 o/e HMEC-1 cells and control, n = 3. ** p ≤ 0.01. c Assessment of eNOS levels by QPCR in the hearts of VE-Cad/RTEF-1 and WT mice, n = 3. ** p ≤ 0.01. d qRT-PCR assay of HMEC-1 cells transfected with nontarget control, RTEF-1 and eNOS siRNAs. e qRT-PCR assay of HMEC-1 cells analyzing eNOS mRNA levels after treatment with 200 nMPD73074.

