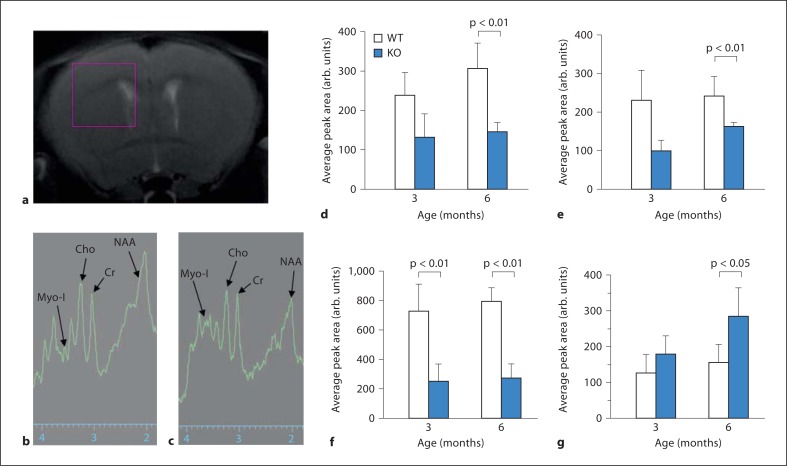
Fig. 2.
Neurodegeneration in Ppt1-KO mice measured by single voxel MRS. MRS of a 2.5 mm3 single volume element (voxel) selected using a pilot MR image which encompassed part of the cortex, the hippocampus and ventricles (a). MR spectra from the chemical shift range of a representative WT (b) and Ppt1-KO (c) mouse showing selected peaks of interest, creatine (Cr), choline (Cho), NAA and myoinositol (Myo-I). Average areas under the MR peaks of the metabolites creatine (d), choline (e), NAA (f) and myoinositol (g) for WT and Ppt1-KO are shown.

