
Figure 2. Dipping Ratio and Probability of Coronary Artery Calcium 10 to 15 Years Later, Stratified by Sex and Race Subgroups.
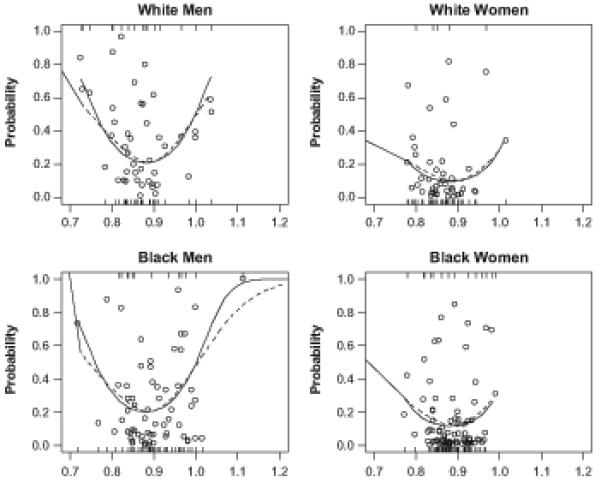
The figure shows the adjusted analysis results across each of the four sex-race subgroups. The U-shaped relationship between nighttime systolic BP dipping (and its quadratic term as a covariate) and presence of future coronary artery calcium is present in all four groups. Circles indicated the predicted probability. The top rug represents the coronary artery calcium cases and the bottom represents the non-cases.