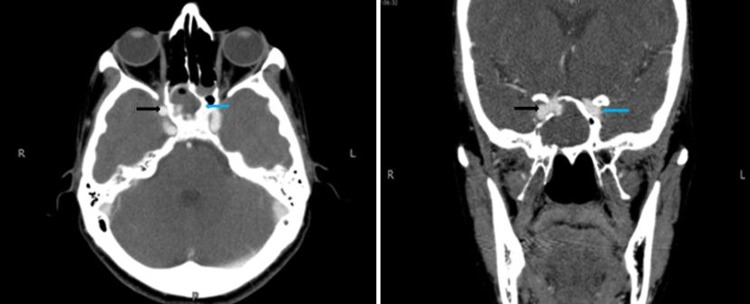
Figure 1.

(A) CT, axial view shows blood and contrast within the right sphenoid sinus (blue arrows) with linear fracture of the lateral wall of the right sphenoid sinus (black arrows), R: right, L: left. (B) CT, coronal view view shows blood and contrast within the right sphenoid sinus (blue arrows) with linear fracture of the lateral wall of the right sphenoid sinus (black arrows), R: right, L: left.
